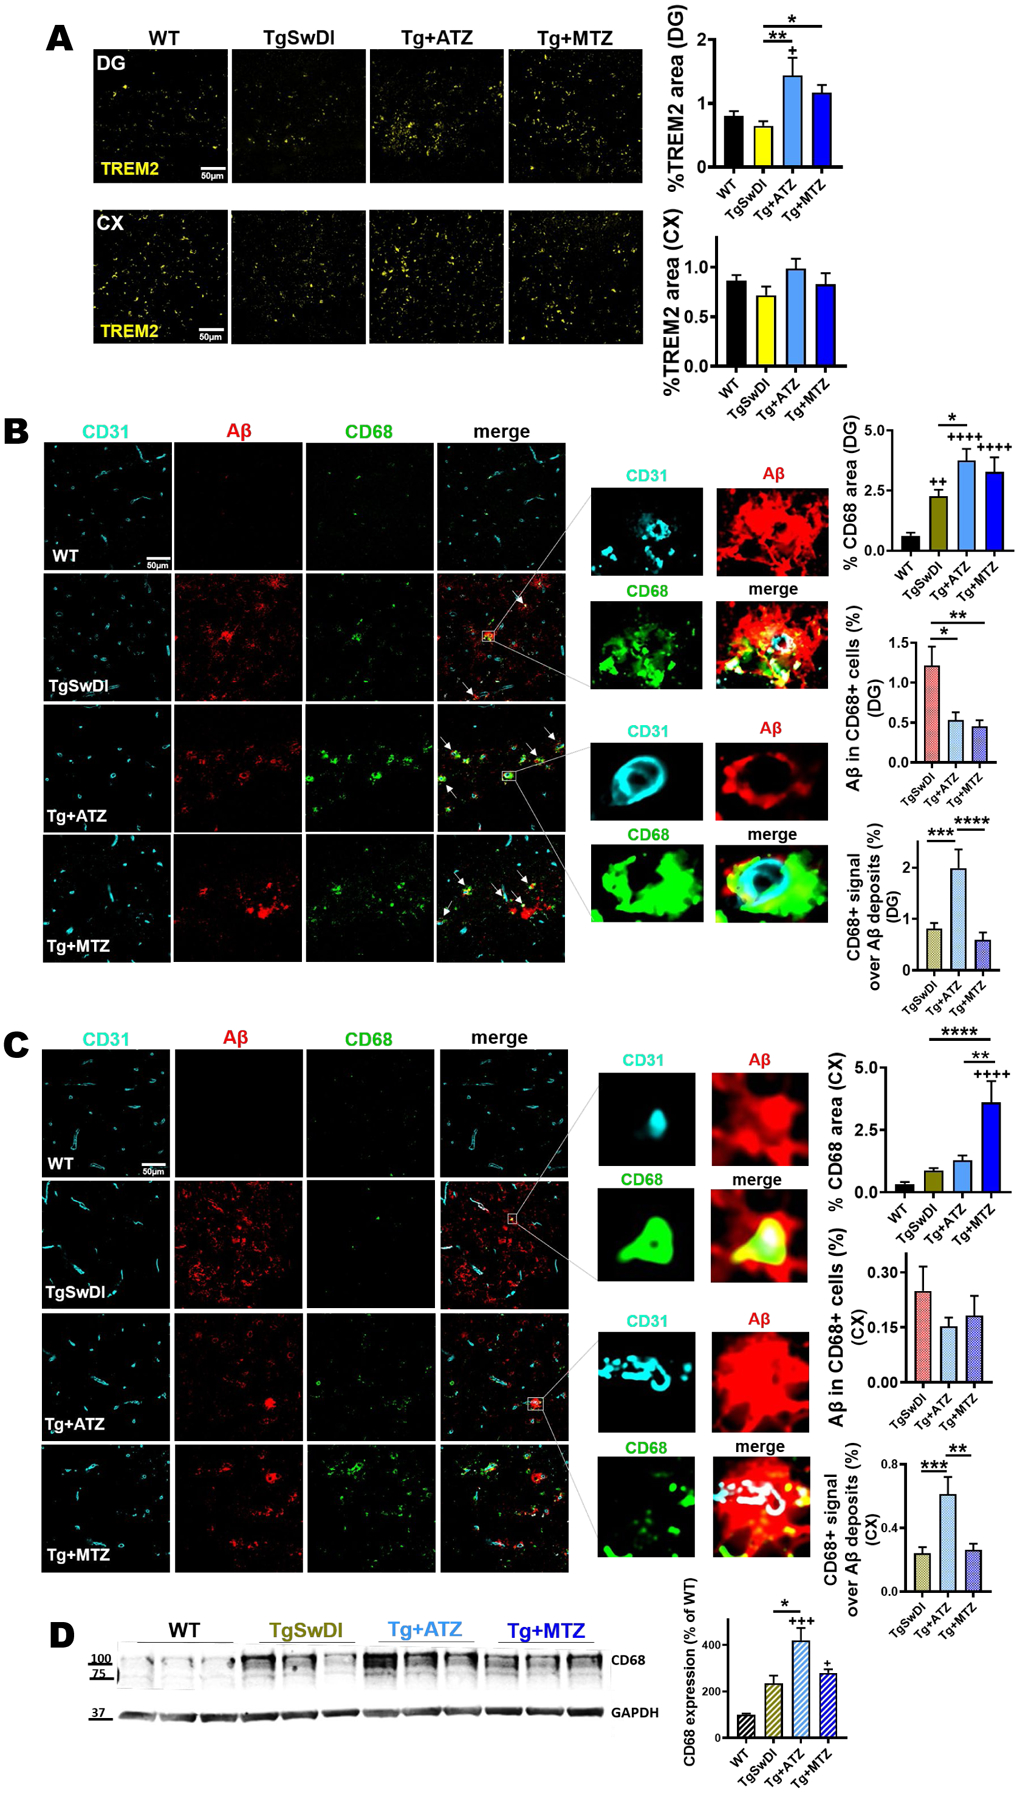
Figure 6: CAI treatment increases TREM2 and CD68+ perivascular phagocytic cells.

A) ATZ and MTZ significantly increase microglial TREM2 expression in DG in TgSwDI mice, and show a trend to increase in the cortex (cx). Relative plots on the right. For % TREM2 area, both in DG and cortex, WT, TgSwDI and MTZ: N=5, ATZ: N=3, n≥9 measurements acquired /group. * and + p<0.05 and **p<0.01, One-way ANOVA and Tukey’s post-hoc test. B, C) Expression of CD68 (green) around microvasculature (CD31, cyan), and co-localization with Aβ (red) in DG (B) and cortex (C). Original magnification, 60x. Scale bar, 50μm. CAI-fed animals present higher phagocytic activity marker (CD68), plotted as %CD68 area per acquisition field, compared to WT and Tg mice. TgSwDI: N=7, WT: N=6, ATZ: N=4, MTZ: N=5, n≥12 measurements acquired/group. * p<0.05, ++ p<0.01, ++++ p<0.0001, One-way ANOVA and Tukey’s post-hoc test. Arrows indicate vascular Aβ internalized by CD68+ perivascular macrophages (PVM), as shown in yellow in the magnified images. On the right, colocalization plots for both Aβ within CD68+ cells (Aβ/CD68) and CD68+ area over Aβ deposits (CD68/Aβ). TgSwDI: N=7, MTZ: N=5, ATZ: N=4, n≥11 measurements/group. For Aβ/CD68 colocalization, * p<0.05 and ** p<0.01. For CD68/Aβ colocalization, *** p<0.001 and **** p<0.0001, ++++P<0.0001. One-way ANOVA and Tukey’s post-hoc test. D) WB of total brain homogenates showing that CD68 expression is significantly increased by CAIs, particularly ATZ. N=3/group, * and + p<0.05, +++ p<0.001, One-way ANOVA and Tukey’s post-hoc test. Data are expressed as mean ± SEM.
