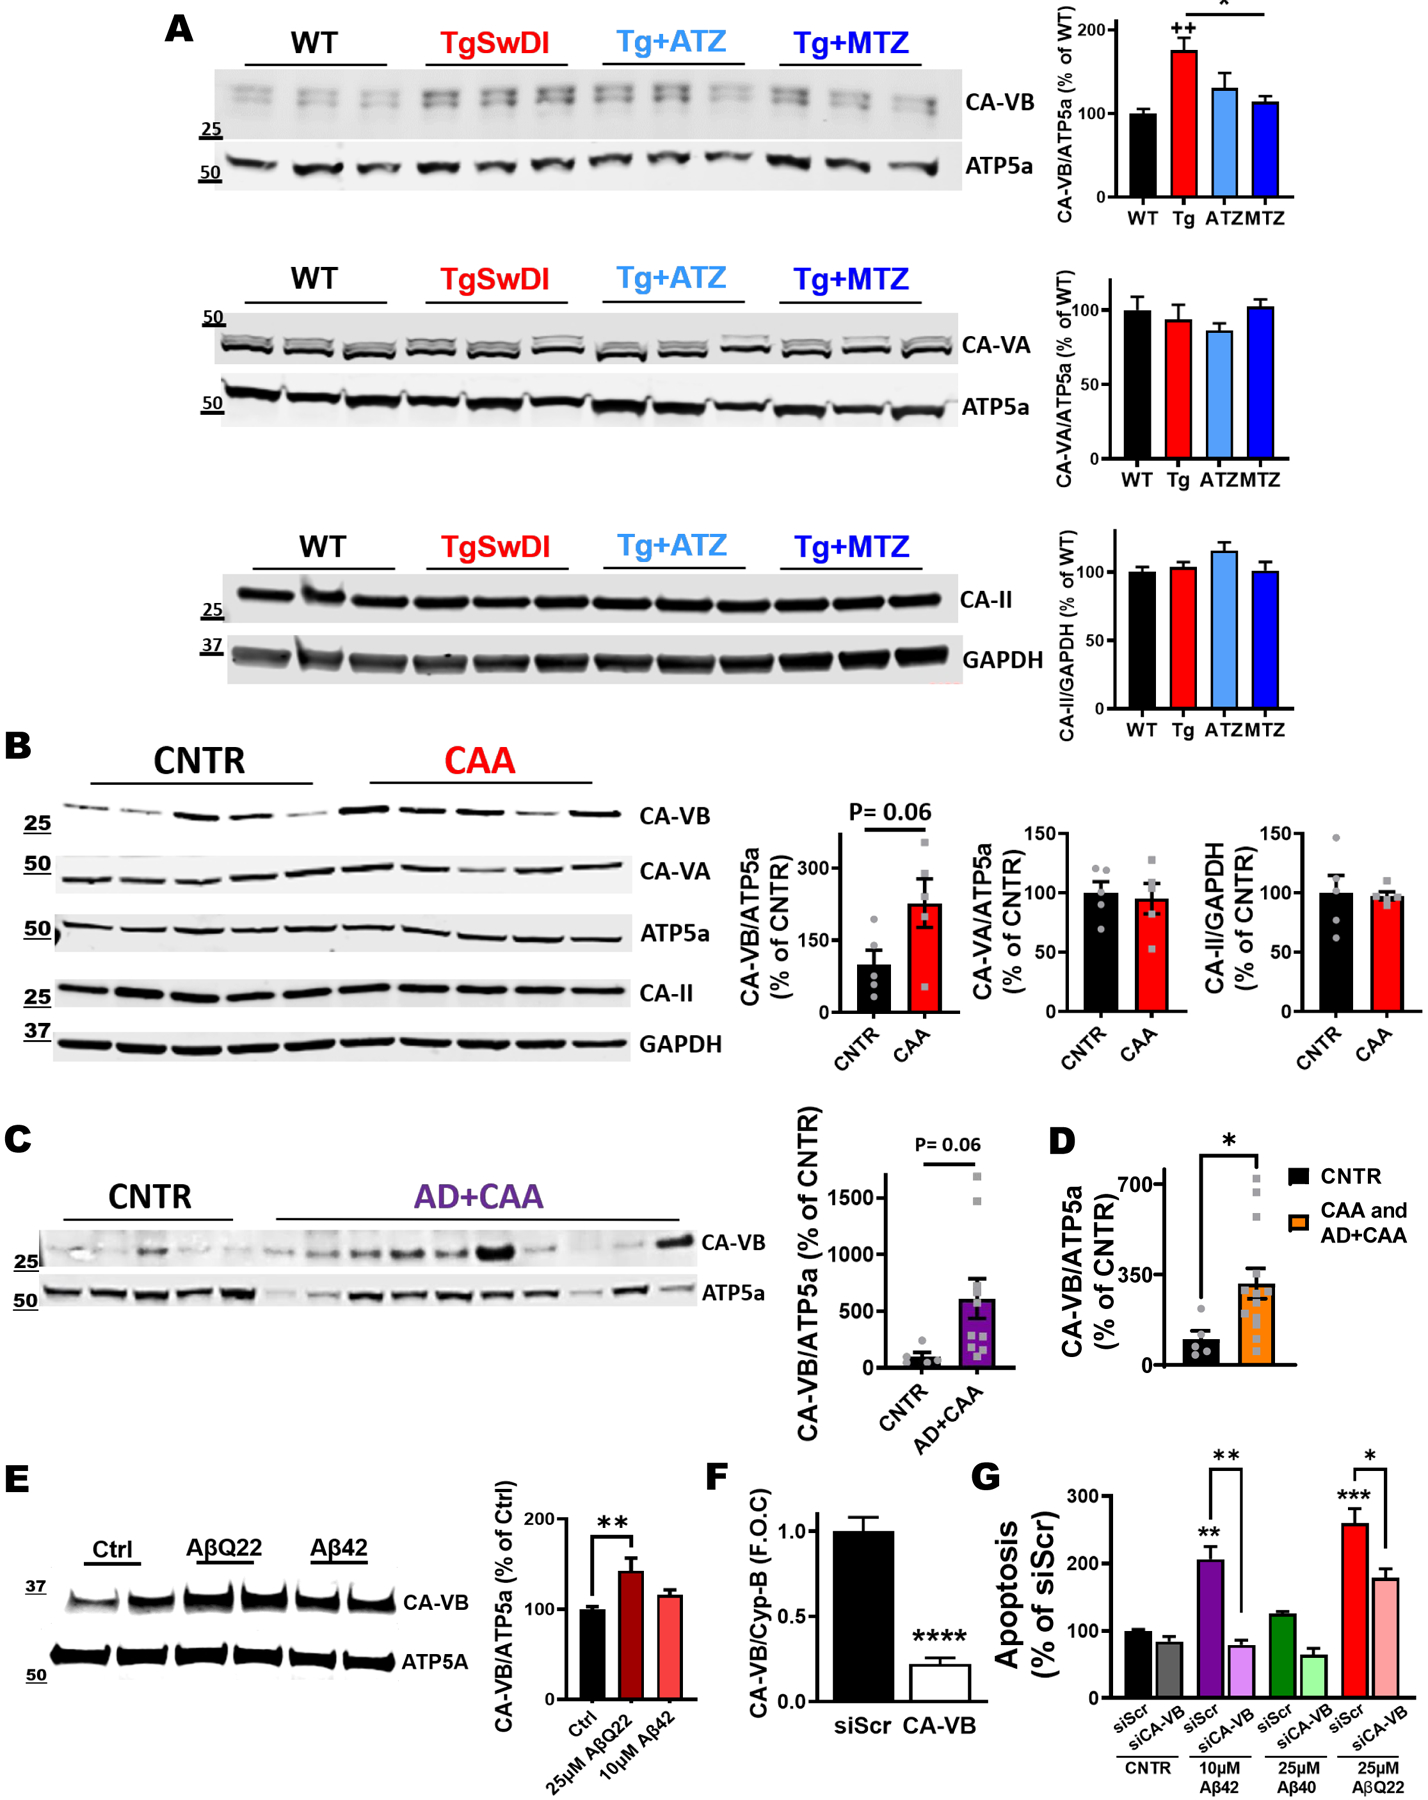
Figure 7: CA-VB expression increases in Tg mice, AβQ22-treated ECs and CA-VB silencing prevents endothelial apoptosis.

A) Immunoblot for CA-VA, -VB and -II in total brain lysates of 16-month-old mice. TgSwDI brains display a significant increase in the mitochondrial carbonic anhydrase-VB (CA-VB) compared to age-matched WT mice, while CAI-treated brains do not show the CA-VB increase (CA-VB normalized to the mitochondrial protein ATP5a). The expression of CA-VA (normalized to ATP5a) and of CA-II (normalized to GAPDH) does not change. N=3 animals/group, n=6 technical replicates/group. * p<0.05 and ++ p<0.01, One-way ANOVA and Tukey’s post-hoc test. B, C) Biochemical analysis of mitochondrial carbonic anhydrases in human cortices. CA-VB expression is upregulated in CAA (+127%, p=0.06) (B) and in AD+CAA subjects (+511%, p=0.06) (C), compared to healthy controls (CNTR). No significant alterations in CA-VA and CA-II levels, between CAA and CNTR brains (B). CNTR and CAA groups N=5, and AD+CAA group N=10. Two-tailed unpaired t test. D) The combination of CAA and AD+CAA groups shows significant upregulation of CA-VB levels compared to CNTR. CNTR N=5; CAA group combined with AD+CAA group N=15. *p<0.05. Two-tailed unpaired t test. E) Western Blot analysis of CA-VB in cerebral ECs after 24hr challenge with Aβ40-Q22 (25μM) and Aβ42 (10μM). CA-VB was normalized to the mitochondrial protein ATP5a. Quantification is represented on the right. The expression of CA-VB is significantly increased following 24hrs Aβ40-Q22 treatment. Data represents the combination of at least three experiments each with 2 replicates, graphed as mean + SEM. One-way ANOVA and Dunnett’s post-test. **p< 0.01 F) qRT-PCR for mRNA expression levels of CA-VB and Cyp-B (housekeeping control gene) in cerebral ECs 48hrs post-transfection with siRNA for CA-VB (siCA-VB) or with a scrambled siRNA sequence (siScr) as control. **** p<0.0001 vs. siScr, Unpaired two-tailed t-test. G) CA-VB silencing prevents apoptosis, measured as the formation of fragmented nucleosomes (by Cell death ELISAplus), after challenge with Aβ42 (10μM), Aβ40 (25μM) or Aβ40-Q22 (25μM) for 24hrs (starting after the 48hr silencing). The graph displays one representative experiment of at least N=3 experiments, each performed in duplicate (n=2). * p<0.05 and ** p<0.01 vs. siScr control, One-way ANOVA, and Tukey’s post-hoc test. Data are expressed as mean ± SEM.
