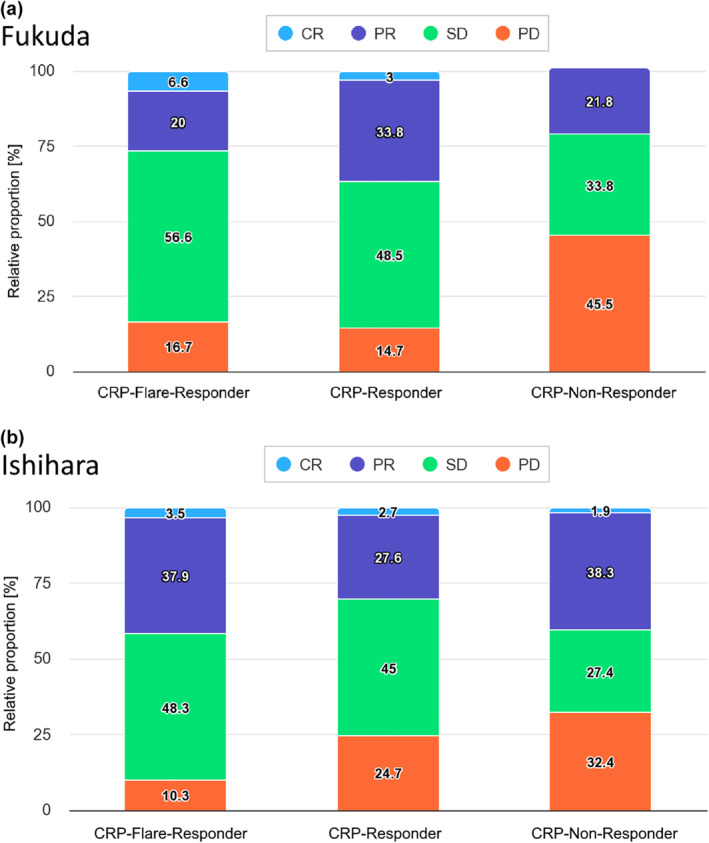
Figure 3.

Stacked bar plots stratifying patients by C‐reactive protein kinetic group according to Fukuda (a) or Ishihara et al. (b) by the respective target lesion change at first staging 3 months after therapy initiation. CR, complete response; PD, progressive disease; PR, partial response; SD, stable disease.
