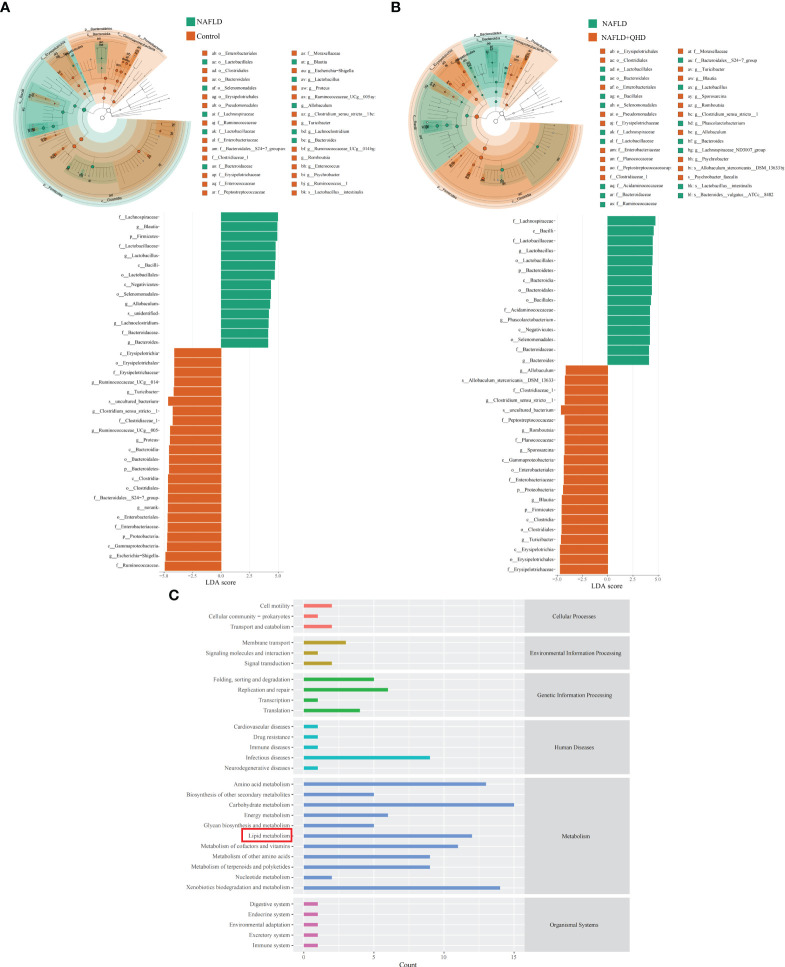
Figure 4.
Dominant gut microbiota and function prediction (n=6). Taxonomic cladograms and linear discriminant analysis scores from LefSe analysis of (A) Comparison between NAFLD and control groups; (B) Comparison between NAFLD and NAFLD+QHD groups are shown. (C) PICRUSt2 analysis based on KEGG pathway was performed to predict the function of the gut microbiota. NAFLD, non-alcoholic fatty liver disease; QHD, Qushi Huayu decoction; LEfSe, linear discriminant analysis of effect size.

