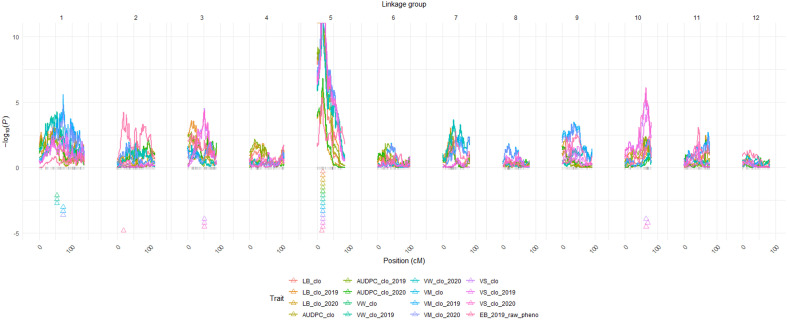
Figure 2.
QTL maps for the six traits. BLUP data abbreviations: LB, Late Blight Foliage Damage; LBAUDPC, Late Blight Area Under the Disease Progress Curve; EB, Early Blight resistance; VW, Verticillium Wilt resistance; VM, Vine Maturity; VS, Vine Size; clo, a genetic effect of clones; 2019, 2019; 2020, 2020 year effects; Triangles indicate the locations of significant QTL peaks. Y axis represents LOP score, which equals – log10 (p-value). *Panel size limit of the QTLpoly prevented QTL having LOP scores over 11 from being completely visualized on chromosome 5 in this figure.

