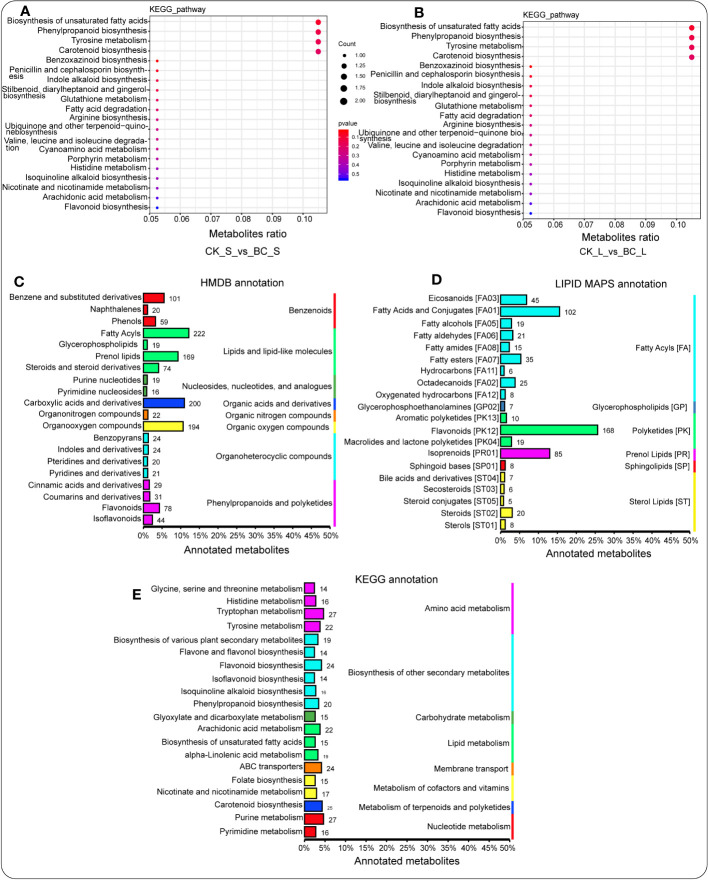
Figure 5.
Enriched KEGG signaling pathway of metabolites in the stem tissue (A) and the leaf tissue (B) under the BC-supplemented field compared with the CK treatment. HMDB database annotations display the hierarchy classification matching the superclass and class information of the HMDB database (C). Lipid maps illuminate the annotated metabolites. The column length characterizes the number of metabolites annotated to a specific classification (D). The column length represents the metabolites annotated. Metabolite annotation using the KEGG pathway. Entry under the same box in the figure symbolizes the hierarchical classification notes of the KEGG pathway. The column length represents the number of metabolites annotated (E).

