
Figure 2. Variants of Uncertain Significance (VUSs) by Race, Ethnicity, and Ancestry (REA) Groups, Age, and by Clinical Areas.
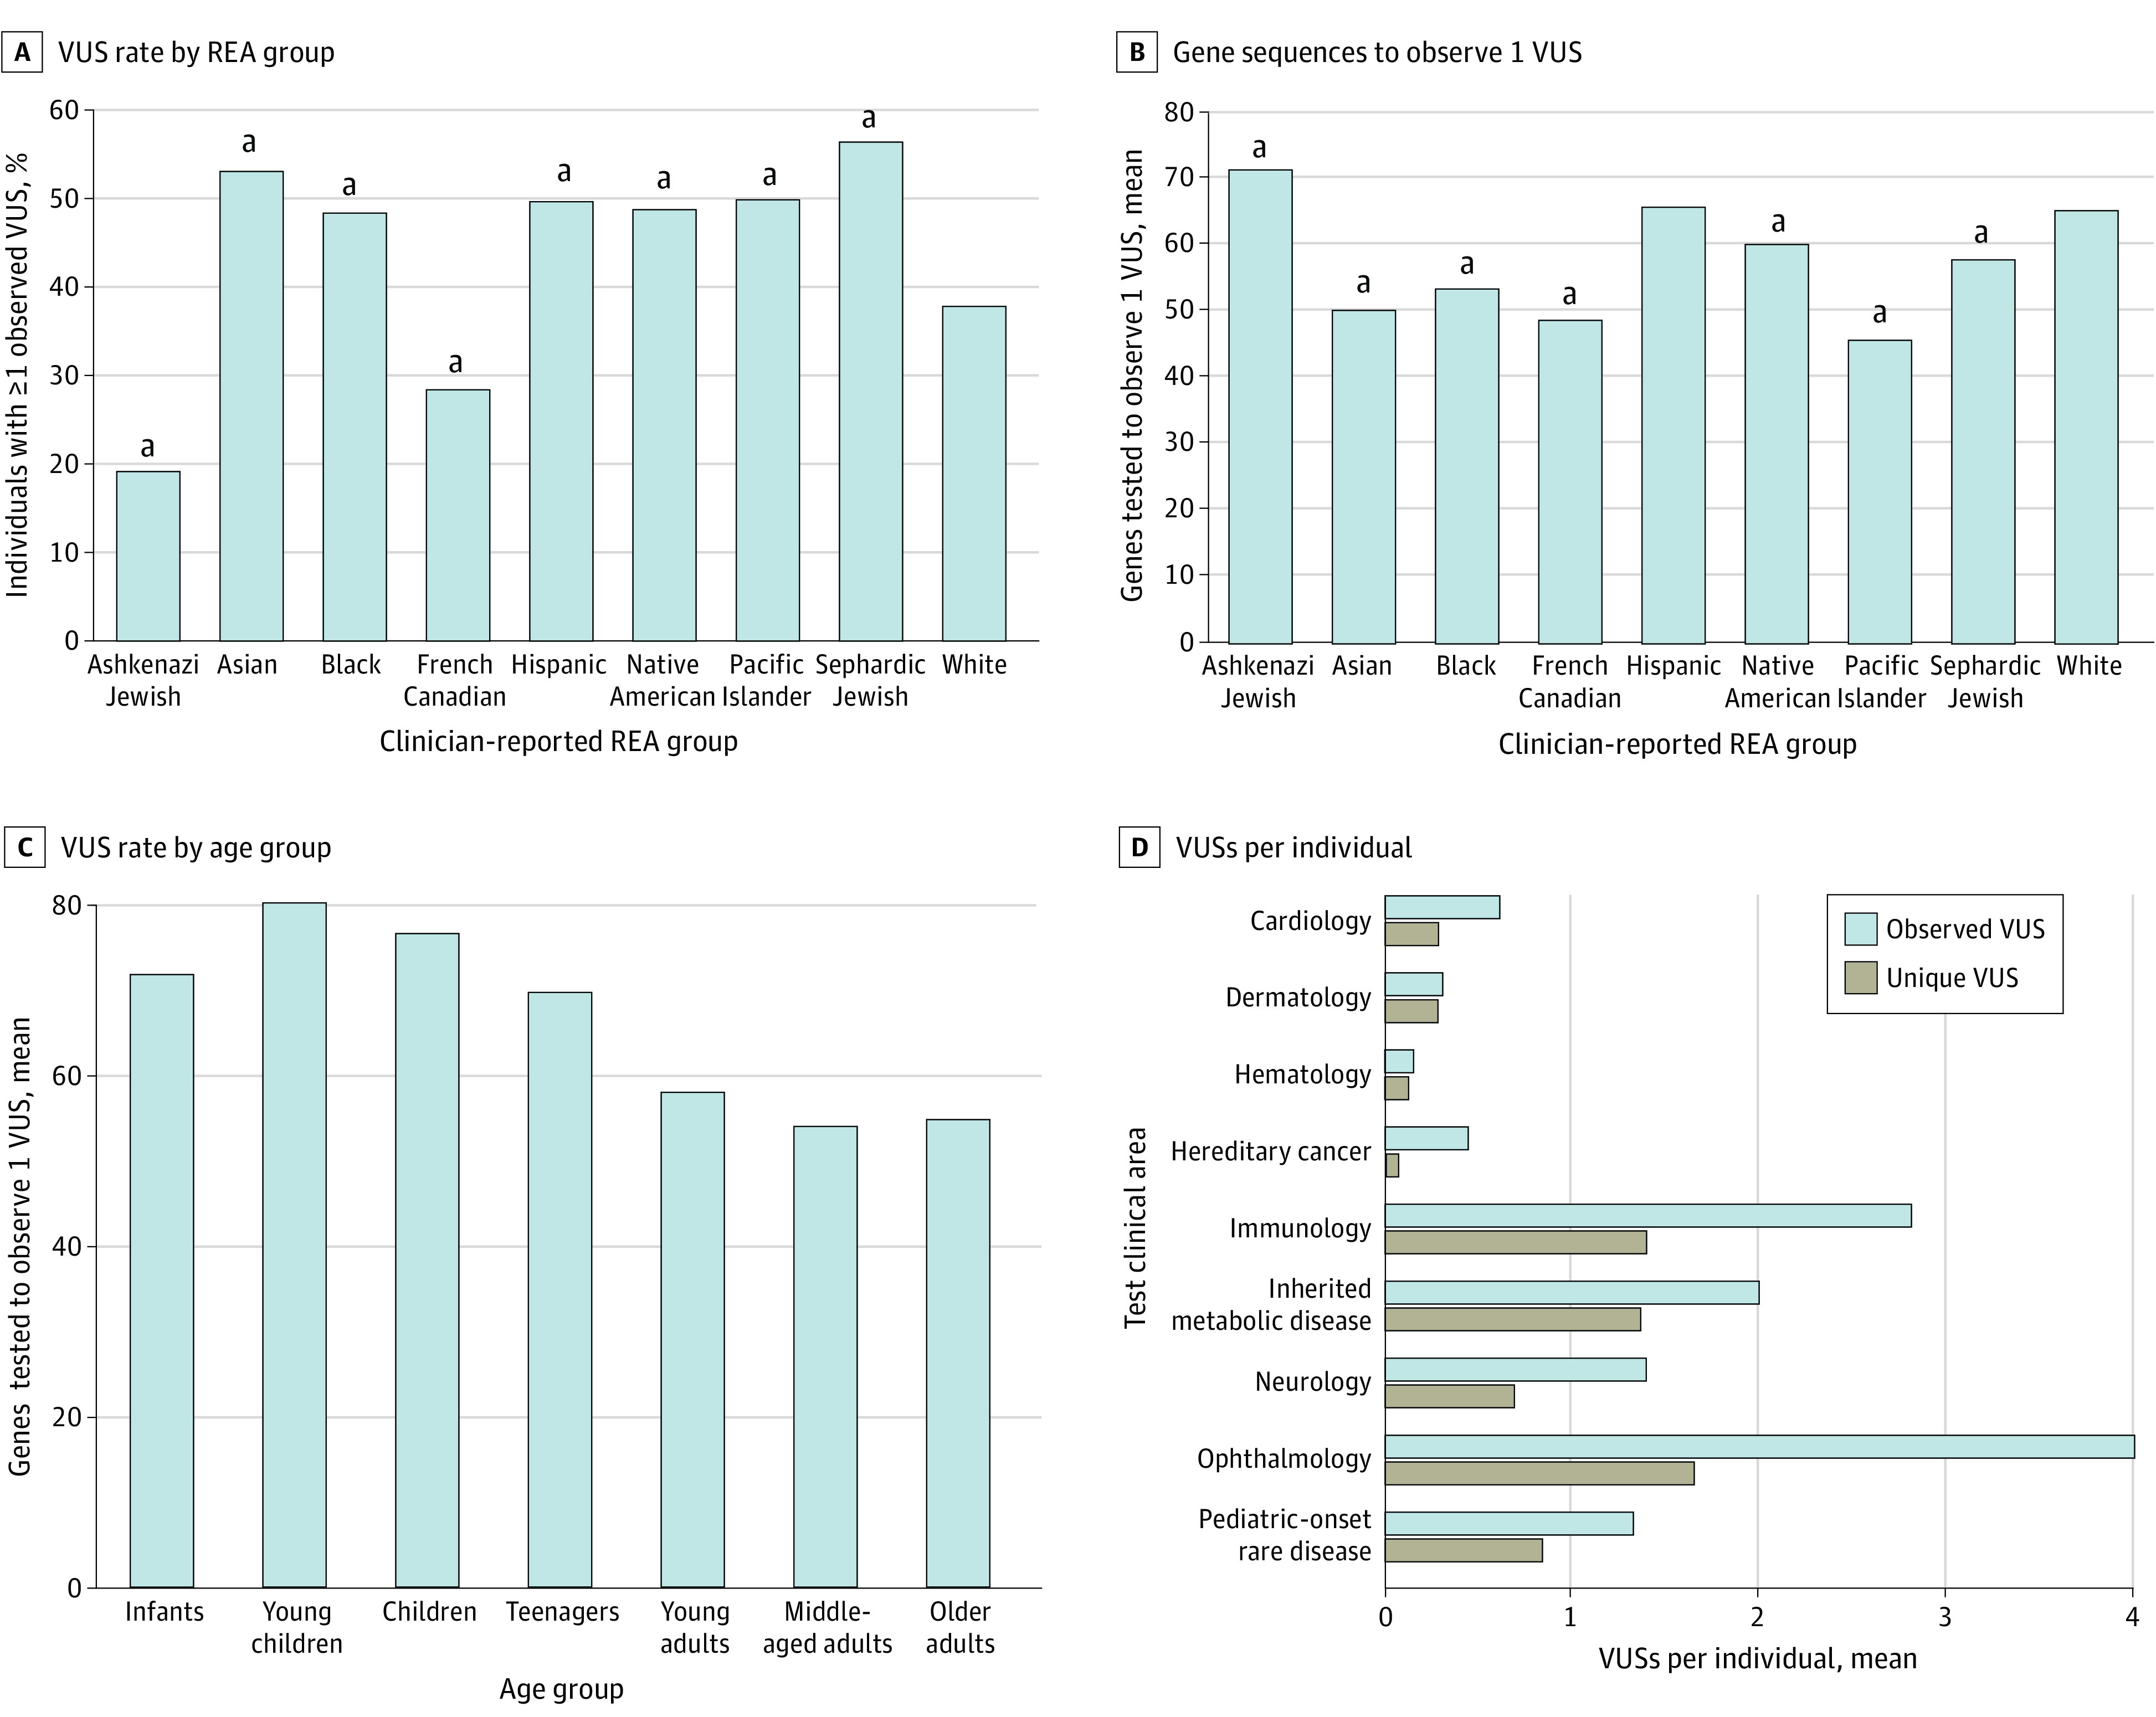
A and B, White individuals were used as the reference group for comparisons. B and C, Higher y-axis value reflects a lower VUS rate. C, Individuals tested at multiple ages (n = 8871) were treated as multiple individuals. Normalized VUS rates differed significantly among age groups (P < .001). Age group definitions are provided in the eAppendix in Supplement 1.
aP < .001.