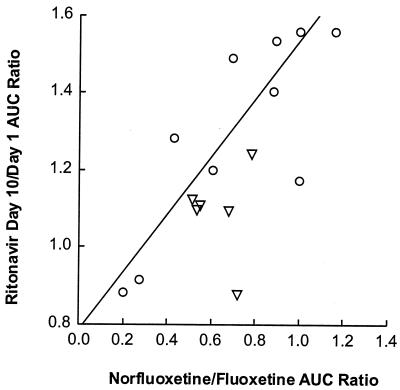
FIG. 5.
Ratio of ritonavir AUC∞ (day 10/day 1) versus norfluoxetine/fluoxetine AUC24 ratio. Circles represent subjects with the CYP2D6 wt/wt genotype; triangles represent subjects with the CYP2D6 B/wt genotype. Symbols represent individual data; the line represents the results of the regression analysis. The parameters of the regression line were as follows: intercept, 0.785 ± 0.118; slope, 0.751 ± 0.190; P = 0.002; r2 = 0.527.

