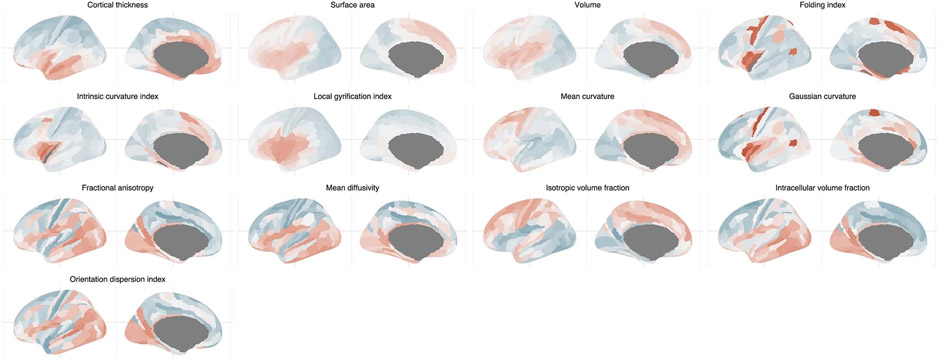
Extended Data Fig. 6 ∣. Topography of the first phenotypic principal components.
Color scales depict the relative eigenvector ranging from −20 to +29, in all plots the midpoint is defined as 0. It should be noted that the sign is somewhat ambiguous and that the magnitude is relative to its own scaling (in this case within each phenotype for which the PCA is performed). Thus, in this context, the color scale indicates to what extent regions show more homogenous similarity (that is, regions with more similar color have more similar covariance).

