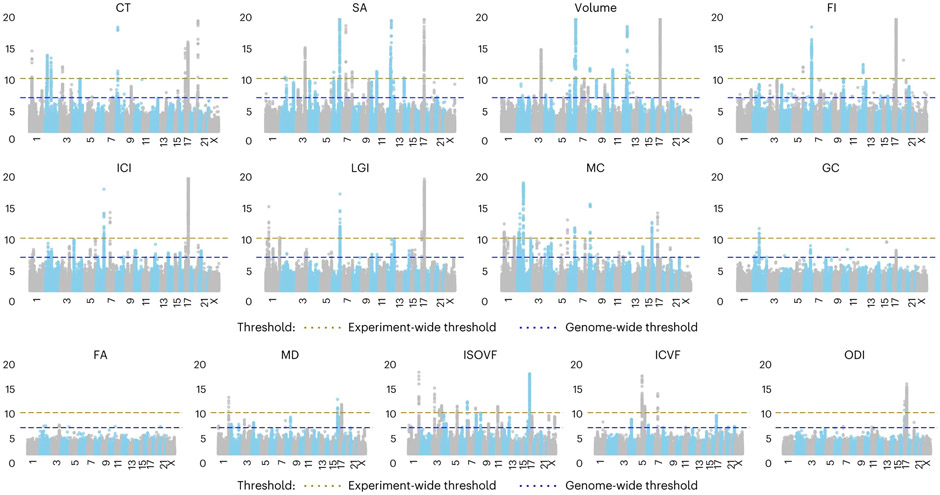
Fig. 2 ∣. Manhattan plots of GWAS meta-analysis of 13 global MRI phenotypes.
Blue dotted line indicates the threshold for genome-wide significance (P = 5 × 10⁻⁸), and the brown dotted line indicates the threshold for experiment-wide significance (P = 4.58 × 10⁻¹¹). Each dot on the x axis indicates an SNP and the y axis indicates the −log10(P values). All analyses were conducted by linear mixed models.

