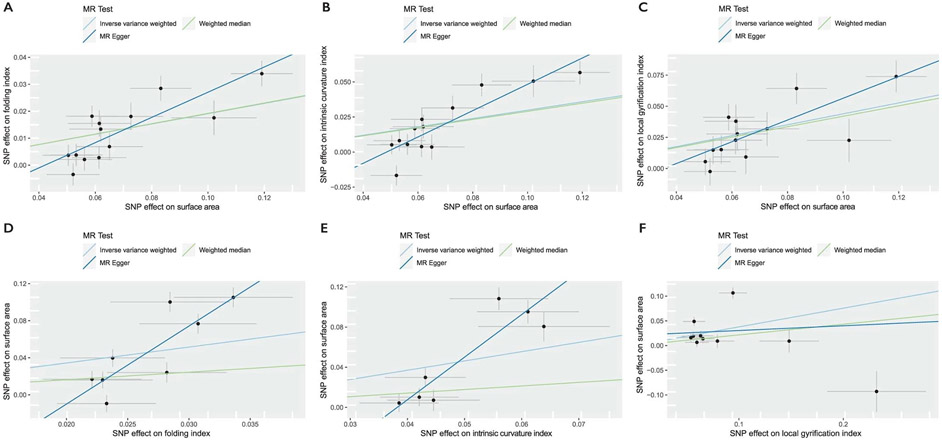
Extended Data Fig. 2 ∣. Mendelian randomization analysis for causal relationships between genetic effects on global brain phenotypes.
Scatter plots for the bidirectional MR effects between surface area and folding index, intrinsic curvature index, and local gyrification index. Slopes of the line (MR regression coefficient) indicate the estimated MR effect by method. Linear a, b, and c are scatter plots where surface area is the exposure, and d, e, and f are scatter plots where surface area is the outcome. All scatter plots are for MR analyses conducted by splitting the UKB into two samples of similar sample sizes. All estimates were statistically significant in scatter plots A,B, and C. Inverse-variance weighted MR failed to reach statistical significance in scatter plots d, e, and f. Number of SNPs included in the MR are provided in Supplementary Table 9. Error bars represent standard errors of the effect size (point estimates).

