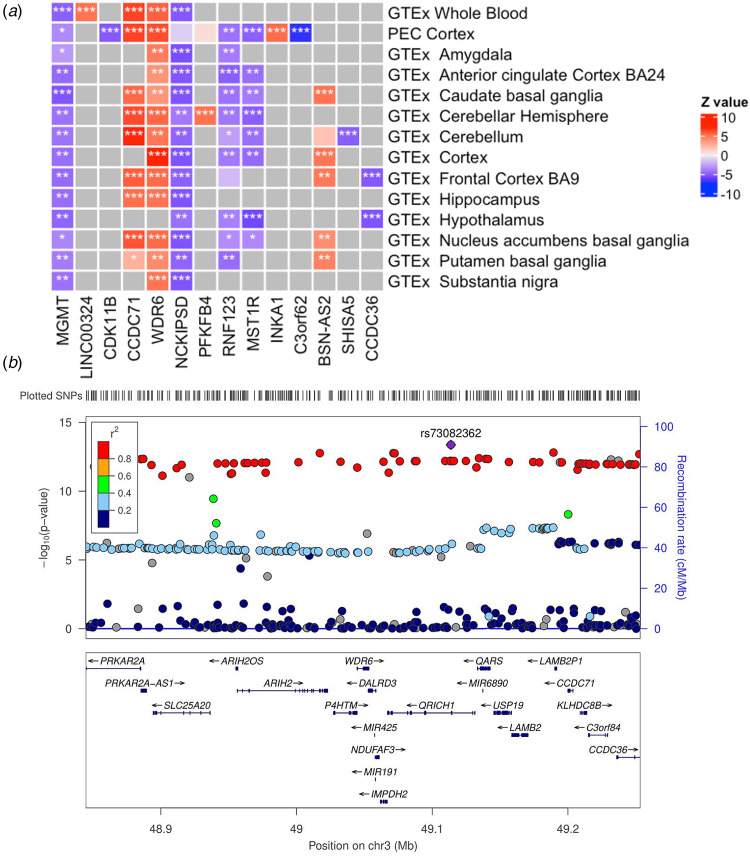
Fig. 1.
TWAS associations and region plot of the densely associated AN signal on chromosome 3. a: Heatmap of genes with at least one Bonferroni significant eQTL tissue associated with AN. Red indicates positive z scores; blue indicates negative z scores (legend). Columns indicates genes, rows indicate tissue models. * Indicates nominally significant genes, ** indicates Benjamini-Hochberg significant associations, *** indicates Bonferroni significant associations. Grey squares indicate that a significantly cis-heritable model of imputed expression data was unavailable in that tissue. b: Relative AN gene and SNP locations and significance. Points in the top panel indicate SNPs, legend indicates r2, left side y-axis indicates the negative log transformed p value of SNPs, right side y-axis indicates the recombination rate (cM/Mb). The bottom panel indicates the location of genes relative to the top panel SNPs. Plot generated using ZoomLocus (Pruim et al., 2010) with 200 kb flanking size. The SNP with the most significant p value in this region: rs73082362 is highlighted.

