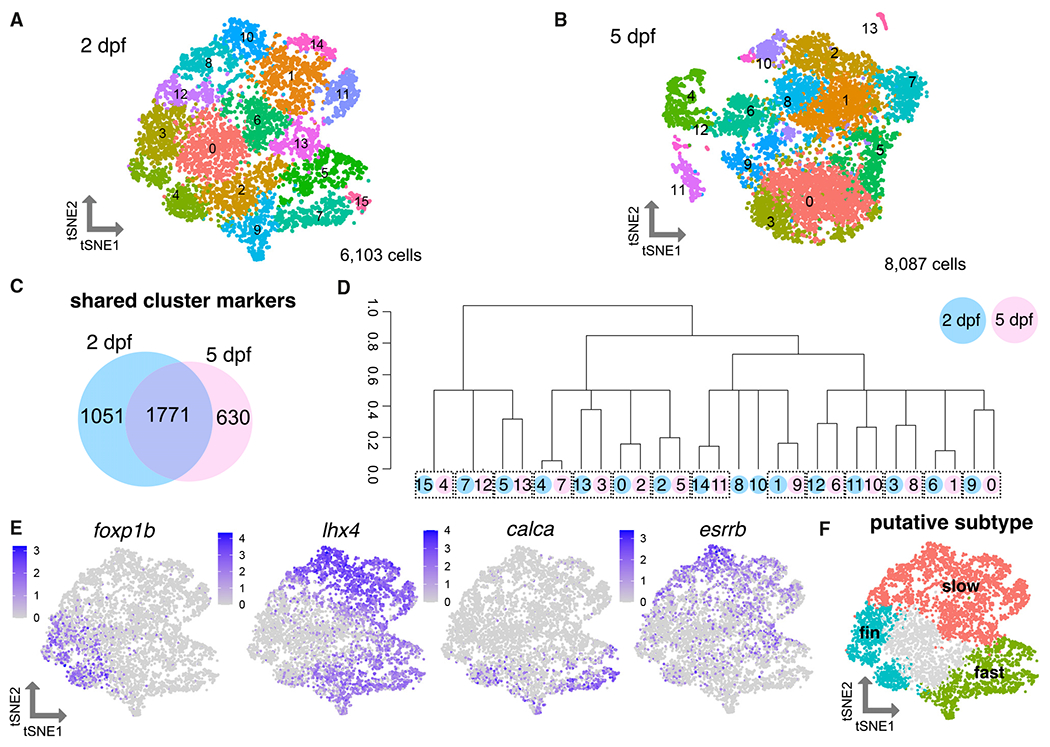
Figure 2. Heterogeneity of motor neuron functional subtypes is identifiable during development and at functional maturity.

(A) tSNE (t-distributed stochastic neighbor embedding) representing 6,103 MNs at 2 dpf.
(B) tSNE representing 8,087 MNs at 5 dpf.
(C) Venn diagram demonstrating overlap in cluster markers from 2 and 5 dpf MNs.
(D) Dendrogram demonstrating relationships between 2 and 5 dpf MN clusters. Circle color indicates age (blue for 2 dpf, pink for 5 dpf). Circle number indicates cluster from (A) or (B). Dotted boxes group a 2 dpf cluster and its most closely related 5 dpf cluster. Expression of Hox genes may also contribute conserved molecular profiles between the 2 and 5 dpf datasets.
(E) Feature plots showing fin (foxp1b), axial (lhx4), fast (calca), and slow (esrrb) MN marker expression within 2 dpf MN clusters as in (A). Purple indicates expression.
(F) General map within tSNE space of putative MN subpopulations within 2 dpf MN clusters.
