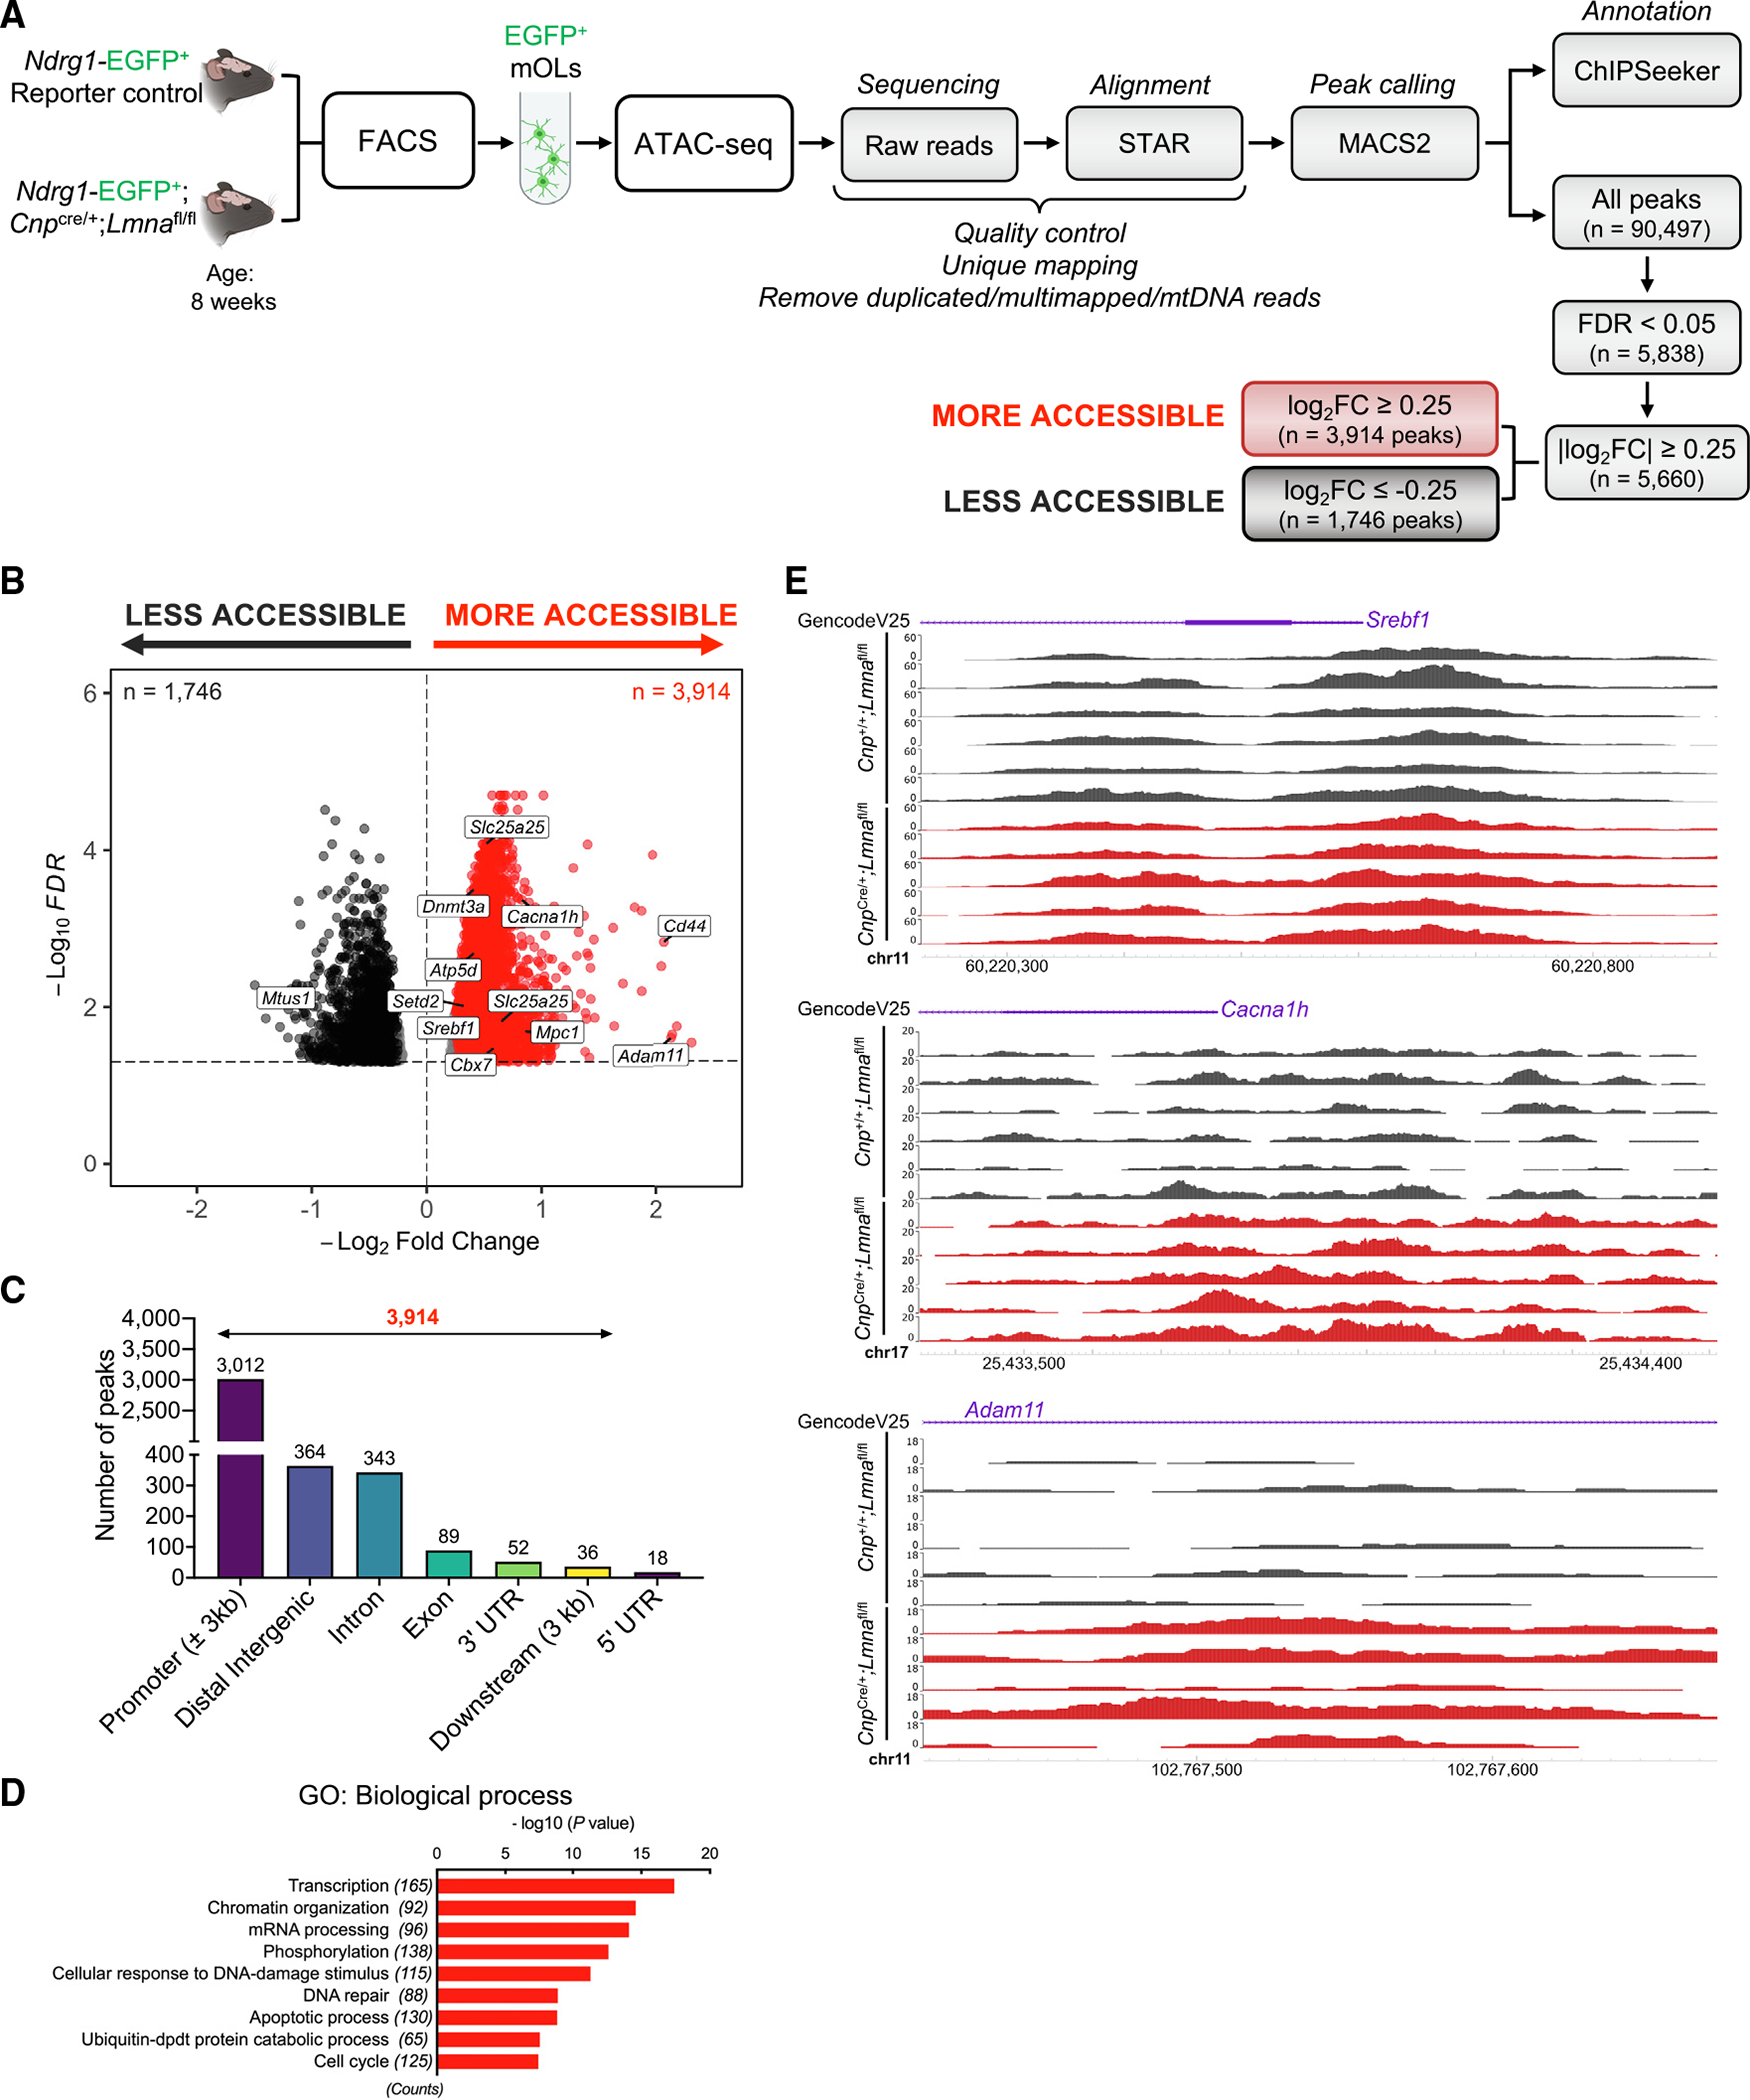
Figure 4. Loss of Lmna in mature OLs increases chromatin accessibility in promoter regions of genes involved in transcription and chromatin organization.

(A) Experimental design and analysis workflow for ATAC-seq on FACS myelinating OLs (mOLs) from the brain of 8-week-old Lmna mutant (Ndrg1-EGFP;CnpCre/+; Lmnafl/fl; n = 5) and control mice (Ndrg1-EGFP;Cnp+/+;Lmnafl/fl; n = 6).
(B) Volcano plot of differential ATAC-seq peaks (FDR < 0.05). Red dots represent more accessible peaks in mutant mOLs compared with controls. Black dots represent less accessible peaks in mutant cells (FDR < 0.05 and |log2 FC| ≥ 0.25), with the dotted line representing threshold for significance.
(C) Bar graph showing genomic distribution of more accessible chromatin peaks (n = 3,914; FDR < 0.05 and |log2 FC| ≥ 0.25) in Lmna mutant mOLs compared with control cells.
(D) Gene Ontology (GO) analysis of the unique genes (n = 2,626) with more accessible chromatin peaks at promoters in Lmna mutant OLs (n = 3,012; FDR < 0.05 and log2 FC ≥ 0.25).
(E) Visualization of ATAC-seq peaks in control mOLs (n = 6; black) and Lmna mutant mOLs (n = 5; red) at the indicated genomic regions. Data were visualized using the WashU Epigenome Browser. The scale on the y axis was selected for optimal visualization of peaks.
See also Figures S5 and S6.
