
Figure 5. Altered transcriptome in mOLs lacking Lmna.
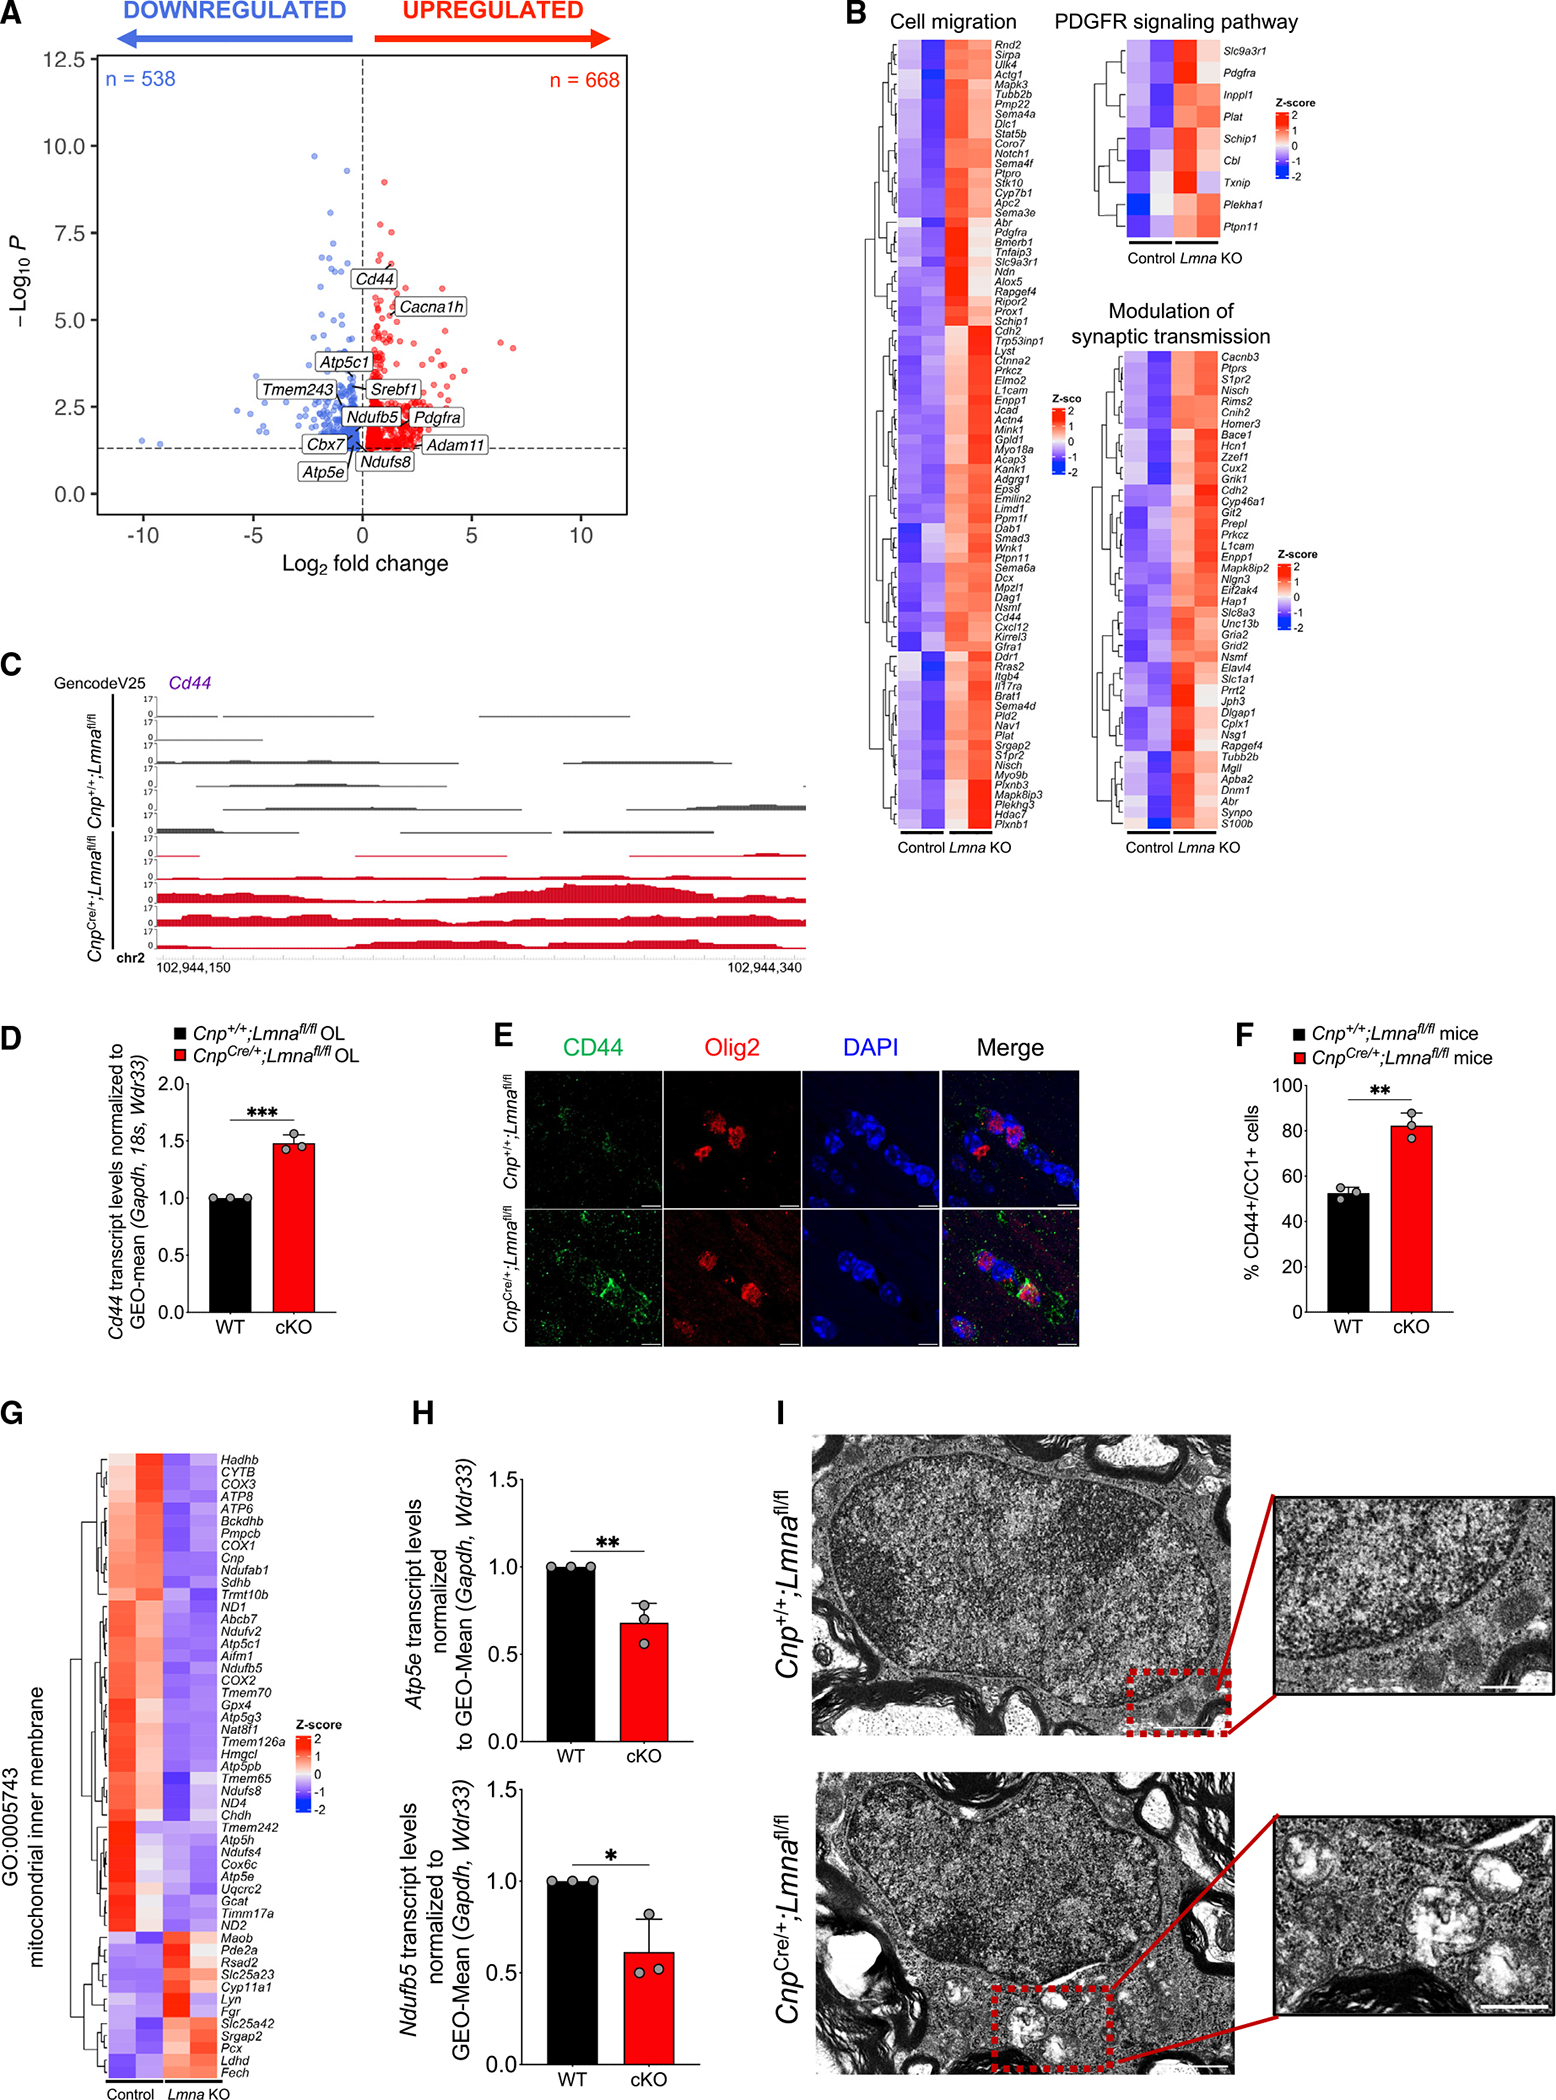
(B) Volcano plot of differentially expressed genes (p < 0.05) in FACS mOLs isolated from 8-week-old Lmna mutant mice (Ndrg1-EGFP;CnpCre/+;Lmnafl/fl, n = 3) and control mice (Ndrg1-EGFP;Cnp+/+;Lmnafl/fl, n = 3). After quality control, the following samples were used for differential expression analysis: n = 2 Lmna mutant and n = 2 control samples. Red dots represent significantly upregulated genes (n = 668), and blue dots represent significantly downregulated genes (n = 538).
(C) Gene expression heatmaps of upregulated biological process Gene Ontology (GO) terms in significantly upregulated (red) or downregulated (blue) genes in Lmna mutant mOLs (Ndrg1-EGFP;CnpCre/+;Lmnafl/fl) compared with control cells (Ndrg1-EGFP;Cnp+/+;Lmnafl/fl). Genes annotated for the GO terms “cell migration,” “PDGFR signaling pathway,” and “modulation of synaptic transmission” are shown.
(C) Visualization of ATAC-seq peaks in control (n = 6, black) and Lmna mutant (n = 5, red) OLs at the distal intergenic region of Cd44. Data were visualized using the WashU Epigenome Browser. The scale on the y axis was selected for optimal visualization of peaks.
(D) Scatterplot of Cd44 transcript levels measured by real-time qPCR in RNA samples extracted from cultured OPCs isolated from WT (Cnp+/+;Lmnafl/fl) and Lmna mutant mice (CnpCre/+;Lmnafl/fl) and differentiated in vitro. Data were normalized to the geometric (GEO)-mean of Gapdh, 18S, and Wdr33 transcript levels. Data represent average levels ± SD, n = 3 independent cultures per group (***p < 0.001, two-tailed Student’s t test).
(E) Representative confocal images of the corpus callosum of WT (Cnp+/+;Lmnafl/fl) and Lmna mutant 26-week-old mice (CnpCre/+;Lmnafl/fl). Sections were stained with CD44 (green) and OLIG2 (red). DAPI (blue) was used as counterstain. Scale bar, 5 μm.
(F) Scatterplot of the number of CD44+/CC1+ cells per mm2 corpus callosum in control mice (Cnp+/+;Lmnafl/fl, n = 3) and Lmna mutant mice (CnpCre/+;Lmnafl/fl, n = 3). Data represent average percentages ± SD (**p < 0.01, two-tailed Student’s t test).
(G) Heatmap of the transcript levels within the “mitochondrial inner membrane” GO category, showing downregulation (blue) in sorted mOLs lacking Lmna (Ndrg1-EGFP;CnpCre/+;Lmnafl/fl) compared with control cells (Ndrg1-EGFP;Cnp+/+;Lmnafl/fl).
(H) Scatterplot of the mitochondrial transcript Atp5e (C) and Ndufb5 (D) levels measured by real-time qPCR in RNA samples extracted from Lmna mutant (CnpCre/+; Lmnafl/fl) and control (Cnp+/+;Lmnafl/fl) OLs, differentiated in cultures from neonatal OPCs. Data were normalized to the geometric (GEO)-mean of Gapdh and Wdr33 transcript levels. Data are represented as mean ± SD, n = 3 independent cultures per group (*p < 0.05, **p < 0.01, two-tailed Student’s t test).
(I) Electron microscopy image of OLs in the ventral horn of the spinal cord of Lmna mutant (CnpCre/+;Lmnafl/fl) and control (Cnp+/+;Lmnafl/fl) mice. Scale bar, 1 μm. The insets represent higher-magnification images of the mitochondrial structure in OLs from mice of the two genotypes to highlight the loss of internal cristae definition in mOLs lacking LMNA. Scale bar, 0.5 μm.