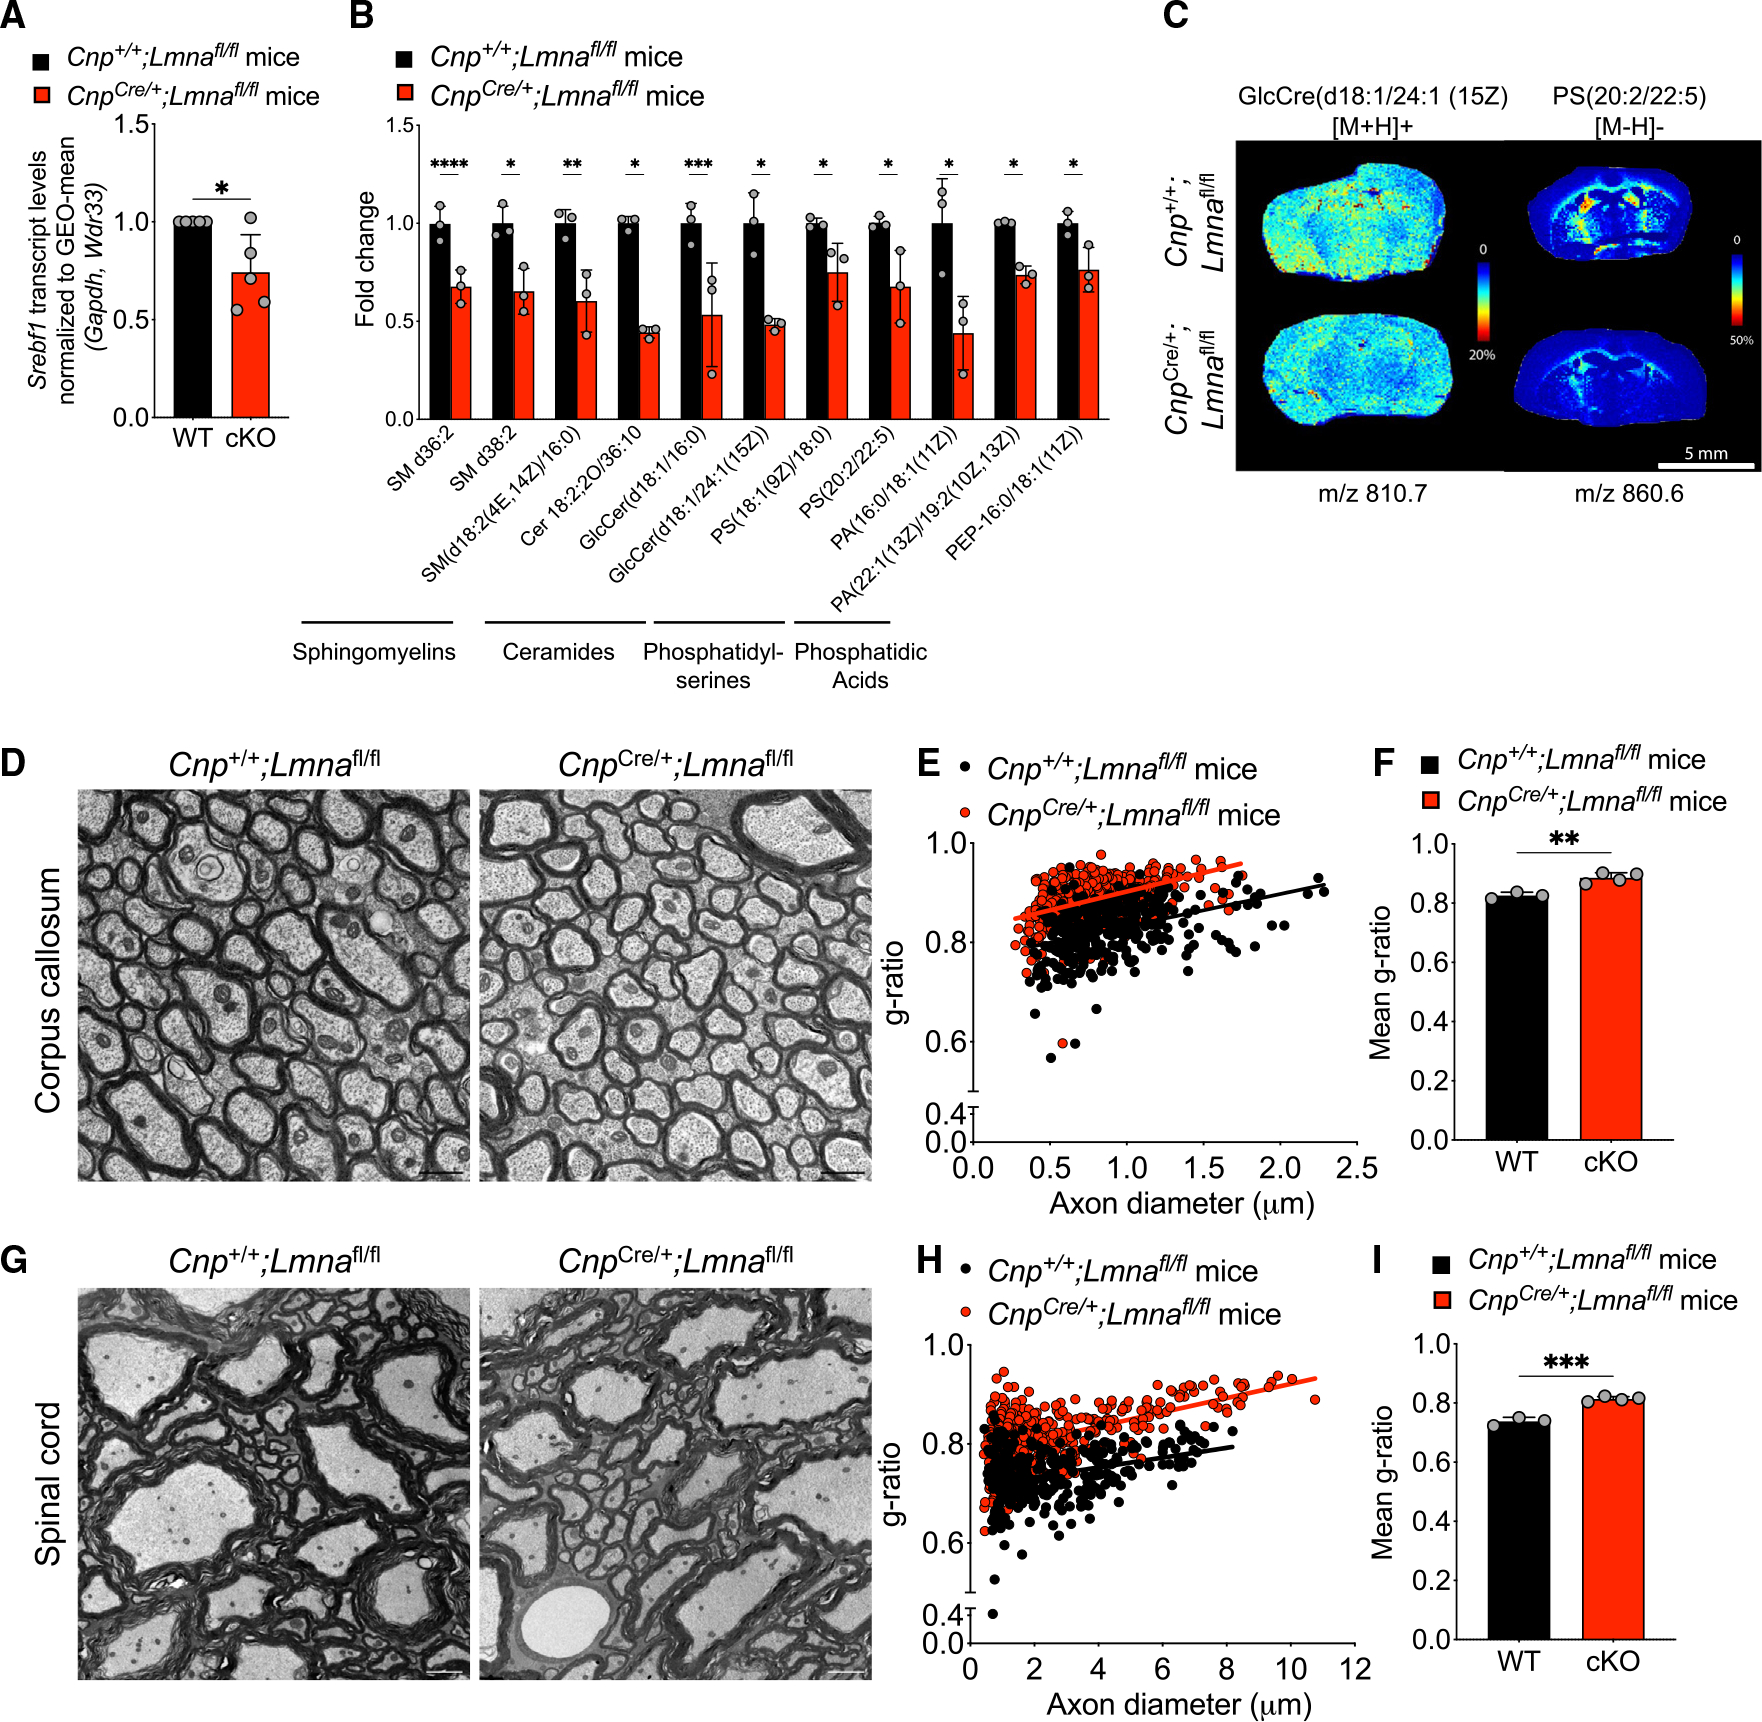
Figure 7. Altered lipid profile and late dysmyelination in Lmna mutants.

(A) Scatterplot of Srebf1 transcript levels measured by real-time qPCR in RNA samples extracted from cultured OL progenitors isolated from WT (Cnp+/+;Lmnafl/fl) and Lmna mutant mice (CnpCre/+;Lmnafl/fl) and differentiated in vitro, relative to WT. Data were normalized to the GEO-mean of Gapdh and Wdr33 transcript levels. Data represent the average ± SD, n = 5 independent cultures per group (*p < 0.05, two-tailed Student’s t test).
(B) Scatterplot of the fold change differences in selected lipids in the brain of Lmna mutants (CnpCre/+;Lmnafl/fl) relative to their levels in control brains, as resulting from the LC-MS analysis. Data represented as mean ± SD (n = 3 mice per group; *p < 0.05, **p < 0.01, ***p < 0.001, ****p < 0.001, Student’s t test).
(C) Representative MALDI imaging of Lmna mutant and control brain sections. Shown in pseudocolor is the relative abundance of selected lipids detected with 2,5-dihydroxybenzoic acid (DHB) matrix (GlcCre(d18:1/24:1 (15Z)) and N-(1-naphthyl) ethylenediamine dihydrochloride (NEDC) matrix (PS(20:2(11Z,14Z)/22:5(4Z,7Z,10Z,13Z,16Z)), abbreviated PS(20:2/22:5)), at the indicated m/z.
(D) Representative electron microscopy images of the corpus callosum of 26-week-old WT and Lmna mutant mice. Scale bar, 1 μm.
(E) Scatterplot of g-ratios relative to the diameter of myelinated axons in the corpus callosum of WT and Lmna mutant mice. Totals of n = 338 axons in 3 WT mice and 462 axons were measured in 4 Lmna mutant mice (WT, slope = 0.065 ± 0.008, intercept = 0.767 ± 0.008; cKO, slope = 0.075 ± 0.007, intercept = 0.827 ± 0.006).
(F) Scatterplot of the average g-ratio ± SD of myelinated axons in the corpus callosum of WT (n = 3) and Lmna mutant mice (n = 4). (**p < 0.01, two-tailed Student’s t test).
(G) Representative electron microscopy images of the spinal cord of 26-week-old WT and Lmna mutant mice. Scale bar, 2 μm.
(H) Scatterplot of g-ratios relative to the diameter of myelinated axons in the spinal cord of WT and Lmna mutant mice. Totals of n = 320 axons in 3 WT mice and 421 axons were measured in 4 Lmna mutant mice (WT, slope = 0.010 ± 0.002, intercept = 0.713 ± 0.005; cKO, slope = 0.014 ± 0.001, intercept = 0.778 ± 0.004).
(I) Scatterplot of the average g-ratio ± SD of myelinated axons in the spinal cord of WT (n = 3) and Lmna mutant mice (n = 4). Data are represented as mean +SD (***p < 0.001, two-tailed Student’s t test).
See also Figure S7.
