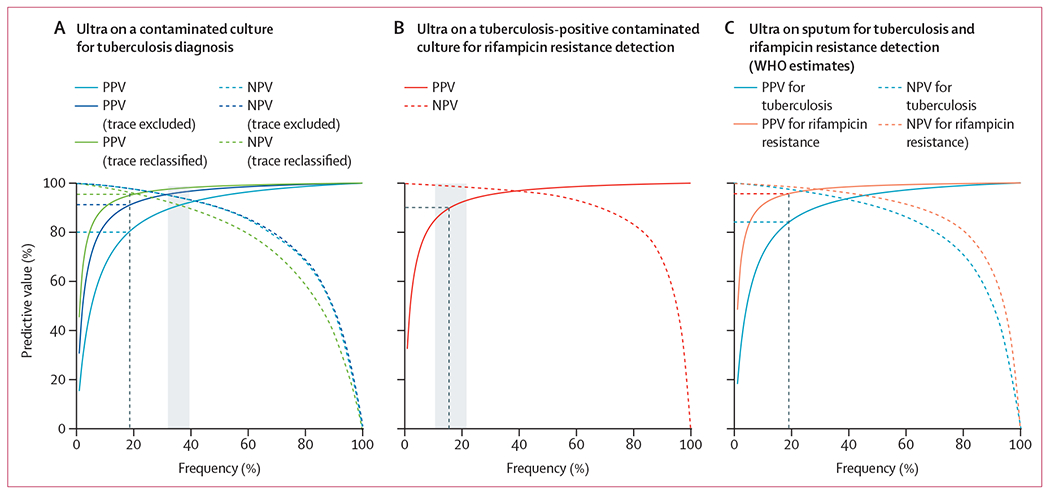
Figure 2: Predictive values of Ultra.

(A) Predictive value of Ultra on AFB-negative, contaminated MGIT960 growth as a function of frequency of tuberculosis (ie, the proportion of patients with an initial culture-contaminated specimen and a later culture-positive specimen); the grey area indicates the observed frequency (36%, 95% CI 33–40); at a frequency of 18%, half of that observed in this cohort (indicated by the black dashed vertical line), Ultra’s PPV is 80%, increasing to 91% with trace exclusion or 95% with trace reclassification strategies, approximating or exceeding that of Ultra on sputum. The curves for NPV and NPV (trace excluded) cannot be readily distinguished because they are almost identical. (B) Predictive value of Ultra on contaminated growth as a function of frequency of rifampicin-resistance (ie, the proportion of patients with an initial culture-contaminated specimen and a later culture-positive, rifampicin-resistant isolate); the grey area indicates the observed frequency (16%, 95% CI 10–23); at the observed frequency, Ultra’s PPV for rifampicin-resistance is 90%, approximating that of Ultra on sputum. (C) Predictive value of Ultra on sputum according to WHO estimates as a function of the proportion of patients with tuberculosis or rifampicin-resistant tuberculosis;24 at a frequency of 19%, Ultra’s PPV is 84% for tuberculosis and 96% for rifampicin resistance. AFB=acid-fast bacillus. NPV=negative predictive value. PPV=positive predictive value. Ultra=Xpert MTB/RIF Ultra.
