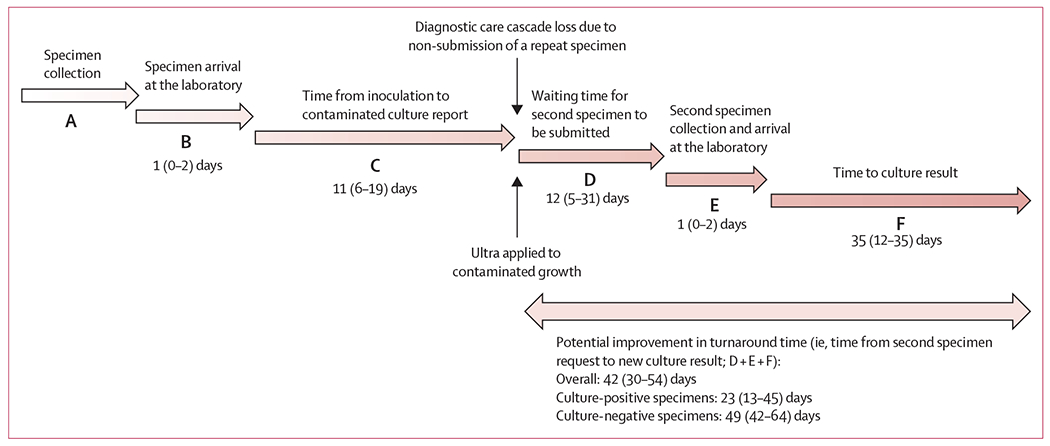
Figure 3: Concept map.

The concept map shows the timeline from the date of initial specimen collection (A) to when it arrives at the laboratory for processing (B) and when it is reported as contaminated (C). At this point, where indicated by the upper vertical arrow, substantial care cascade loss occurs due to a repeat specimen not being submitted. This loss, and the subsequent delays to await collection of another specimen (if received at all; D), deliver to the laboratory (E), and culture the sample (F) could be minimised if the Ultra on contaminated culture approach were applied (bottom vertical arrow) All day values are median (IQR). Ultra=Xpert MTB/RIF Ultra.
