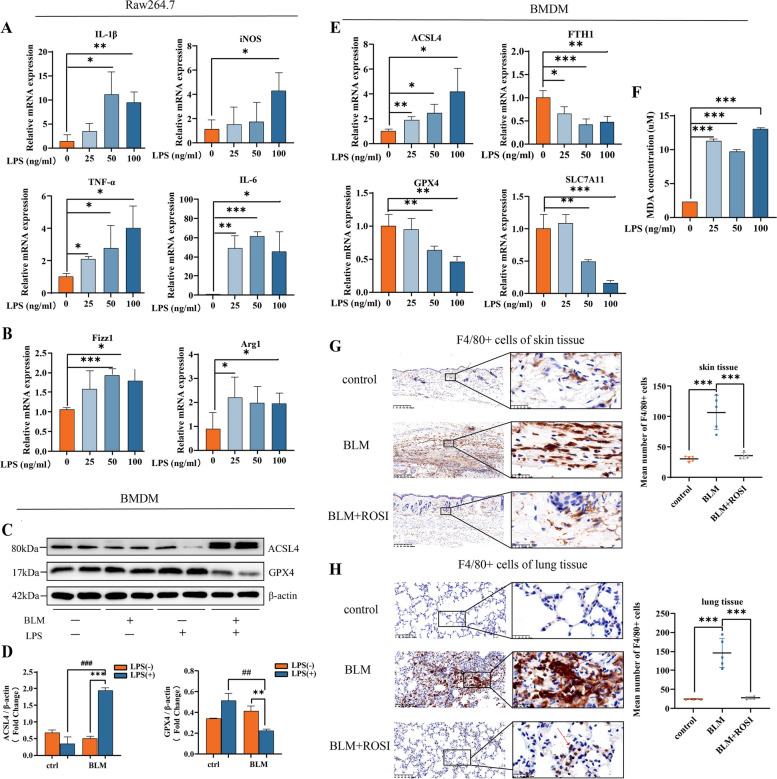
Fig. 3.
M1 upregulates ACSL4 and increases its sensitivity to ferroptosis in SSc. A Relative mRNA levels of M1 markers from Raw264.7 treated with different concentration of LPS. B Relative mRNA levels of M2 markers from Raw264.7 treated with different concentration of LPS. C, D Western blots of ferroptosis markers in BMDM derived from control or BLM group and then treated with PBS or LPS. E Relative mRNA levels of ferroptosis markers in BMDM treated with different concentration of LPS. F Relative MDA levels of BMDM treated with different concentration of LPS. G, H Representative images of immunohistochemistry staining for F4/80 of murine skin (× 100, × 800) and lung tissue (× 200, × 800) (n = 5). (Data are presented as Mean ± SD *p < 0.05, **p < 0.01, ***p < 0.001, * stands for control versus BLM group; #p < 0.05, ##p < 0.01, ###p < 0.001, #stands for PBS treatment versus LPS treatment)

