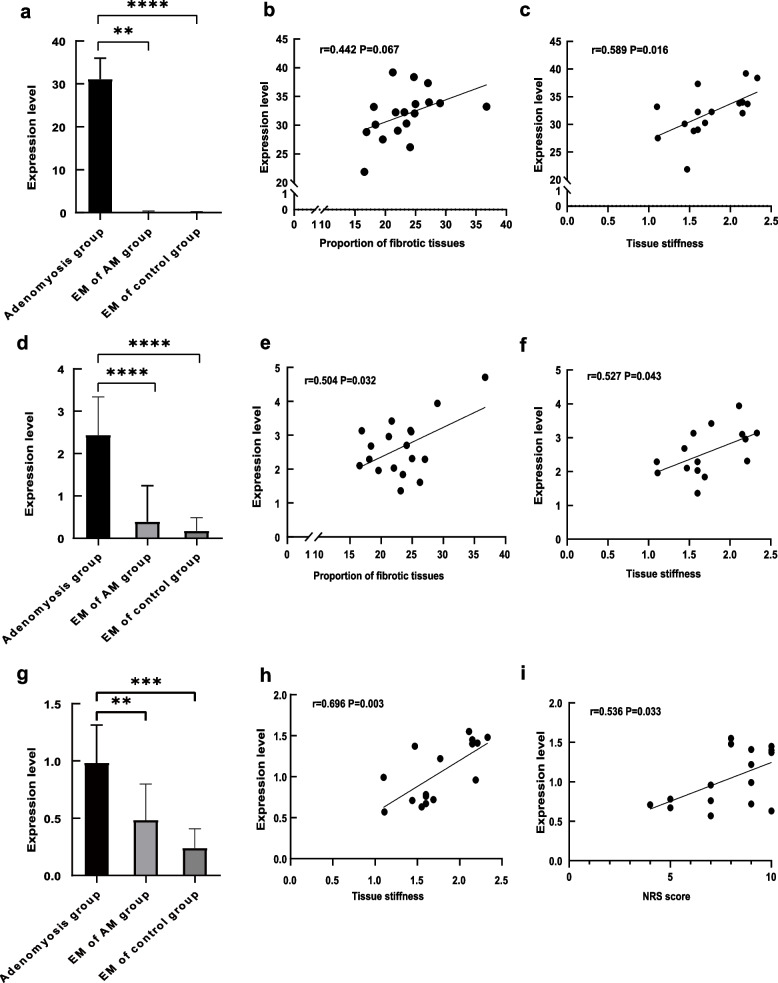
Fig. 5.
a Expression level of α-SMA in adenomyosis lesion, EM of patients with adenomyosis and EM of control group; b Correlation between proportion of fibrotic tissue and expression level of α-SMA; c Correlation between tissue stiffness and expression level of α-SMA; d Expression level of TGF-β in adenomyosis lesion, EM of patients with adenomyosis and EM of control group; e Correlation between proportion of fibrotic tissue and expression level of TGF-β; f Correlation between tissue stiffness and expression level of TGF-β; g Expression level of PGP9.5 in adenomyosis lesion, EM of patients with adenomyosis and EM of control group; h Correlation of tissue stiffness with expression level of PGP9.5; i Correlation between NRS score and expression level of PGP9.5. The results represent the mean ± SD. **P < 0.01 ***P < 0.001 ****P < 0.0001. EM = endometrium, AM = adenomyosis

