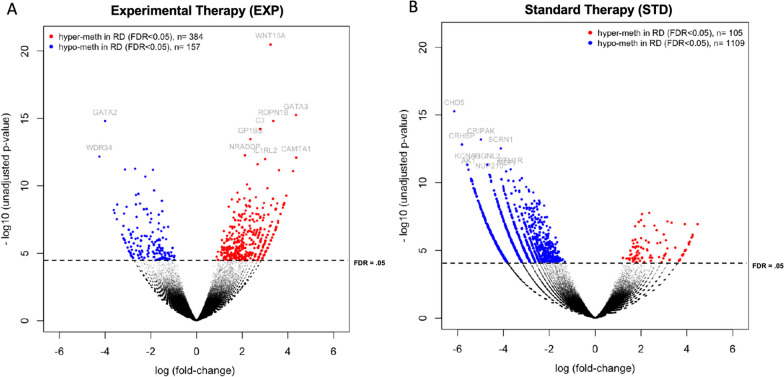
Fig. 2.
Significant Baseline DNA Methylation Differences reveal less methylation in refractory disease of AZA containing treatment regimens. A Volcano Plot illustrating methylation differences between AZA-sensitive and AZA-resistant (Experimental Therapy) as well as B induction sensitive and induction resistant patients (Standard Therapy). Mean methylation difference between the 2 groups is represented on the x axis and statistical significance (-log10 unadjusted p-value) on the y axis. Negative binomial distribution-based testing with edgeR identified 1755 DMRs, indicated by red and blue dots (FDR < 5% with adjustment for multiple testing)

