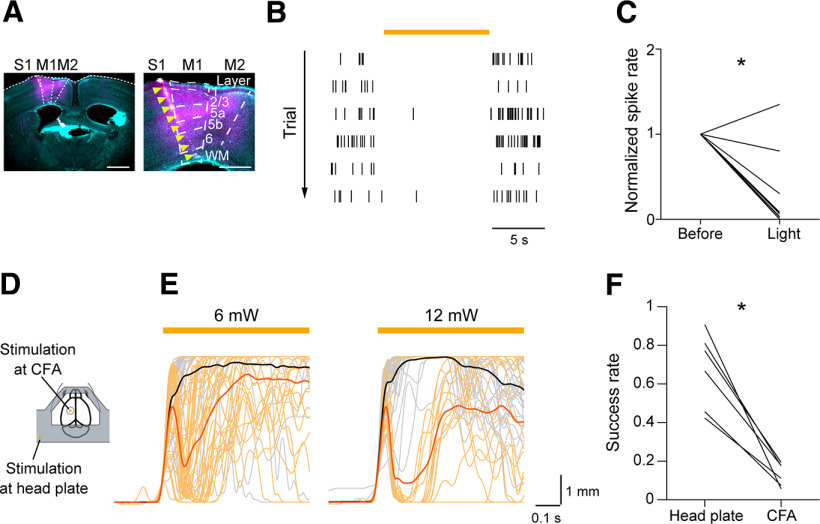
Figure 2.
Inhibition of skilled lever pulls caused by CFA optogenetic manipulations in the test sessions. A, Left, Histological image of the Neuropixels 1.0 probe tract in a coronal section including the CFA that was 0.2 mm anterior to the bregma. Cyan indicates neurons labeled with NeuroTrace. Magenta indicates stGtACR1-FusionRed-expressing neurons. The Neuropixels 1.0 probe was labeled with CM-Dil (indicated by yellow arrowheads). Scale bar, 1 mm. Right, Magnification of the image on the left. Scale bar, 0.5 mm. WM, white matter. B, Raster plots of spikes from a representative M1 L5 unit in six light illumination trials at 12 mW. The orange bar indicates the light illumination. C, A summary of normalized spike rates of M1 L5 units before and during light illumination, *p = 6.4 × 10⁻⁴ by paired t test, n = 10 units. D, Schematic image of the light illumination sites on the head plate and CFA. E, Left, Lever traces in optogenetic stimulation trials at 6 mW. Lever traces in the head plate illumination trials (n = 37 trials, black) and in the CFA illumination trials (n = 34 trials, orange) from a representative mouse. Right, Lever traces in optogenetic stimulation trials at 12 mW. Lever traces in the head plate illumination trials (n = 40 trials, black) and in the CFA illumination trials (n = 16 trials, orange) from a representative mouse, the same mouse as on the left. Mean lever trajectories in each type of trial are shown as thick lines. The orange bar indicates light illumination. F, Summary of the success rate in the head plate illumination trials and the CFA illumination trials at 6 mW, *p = 1.0 × 10⁻³ by paired t test, n = 6 sessions from 3 mice.

