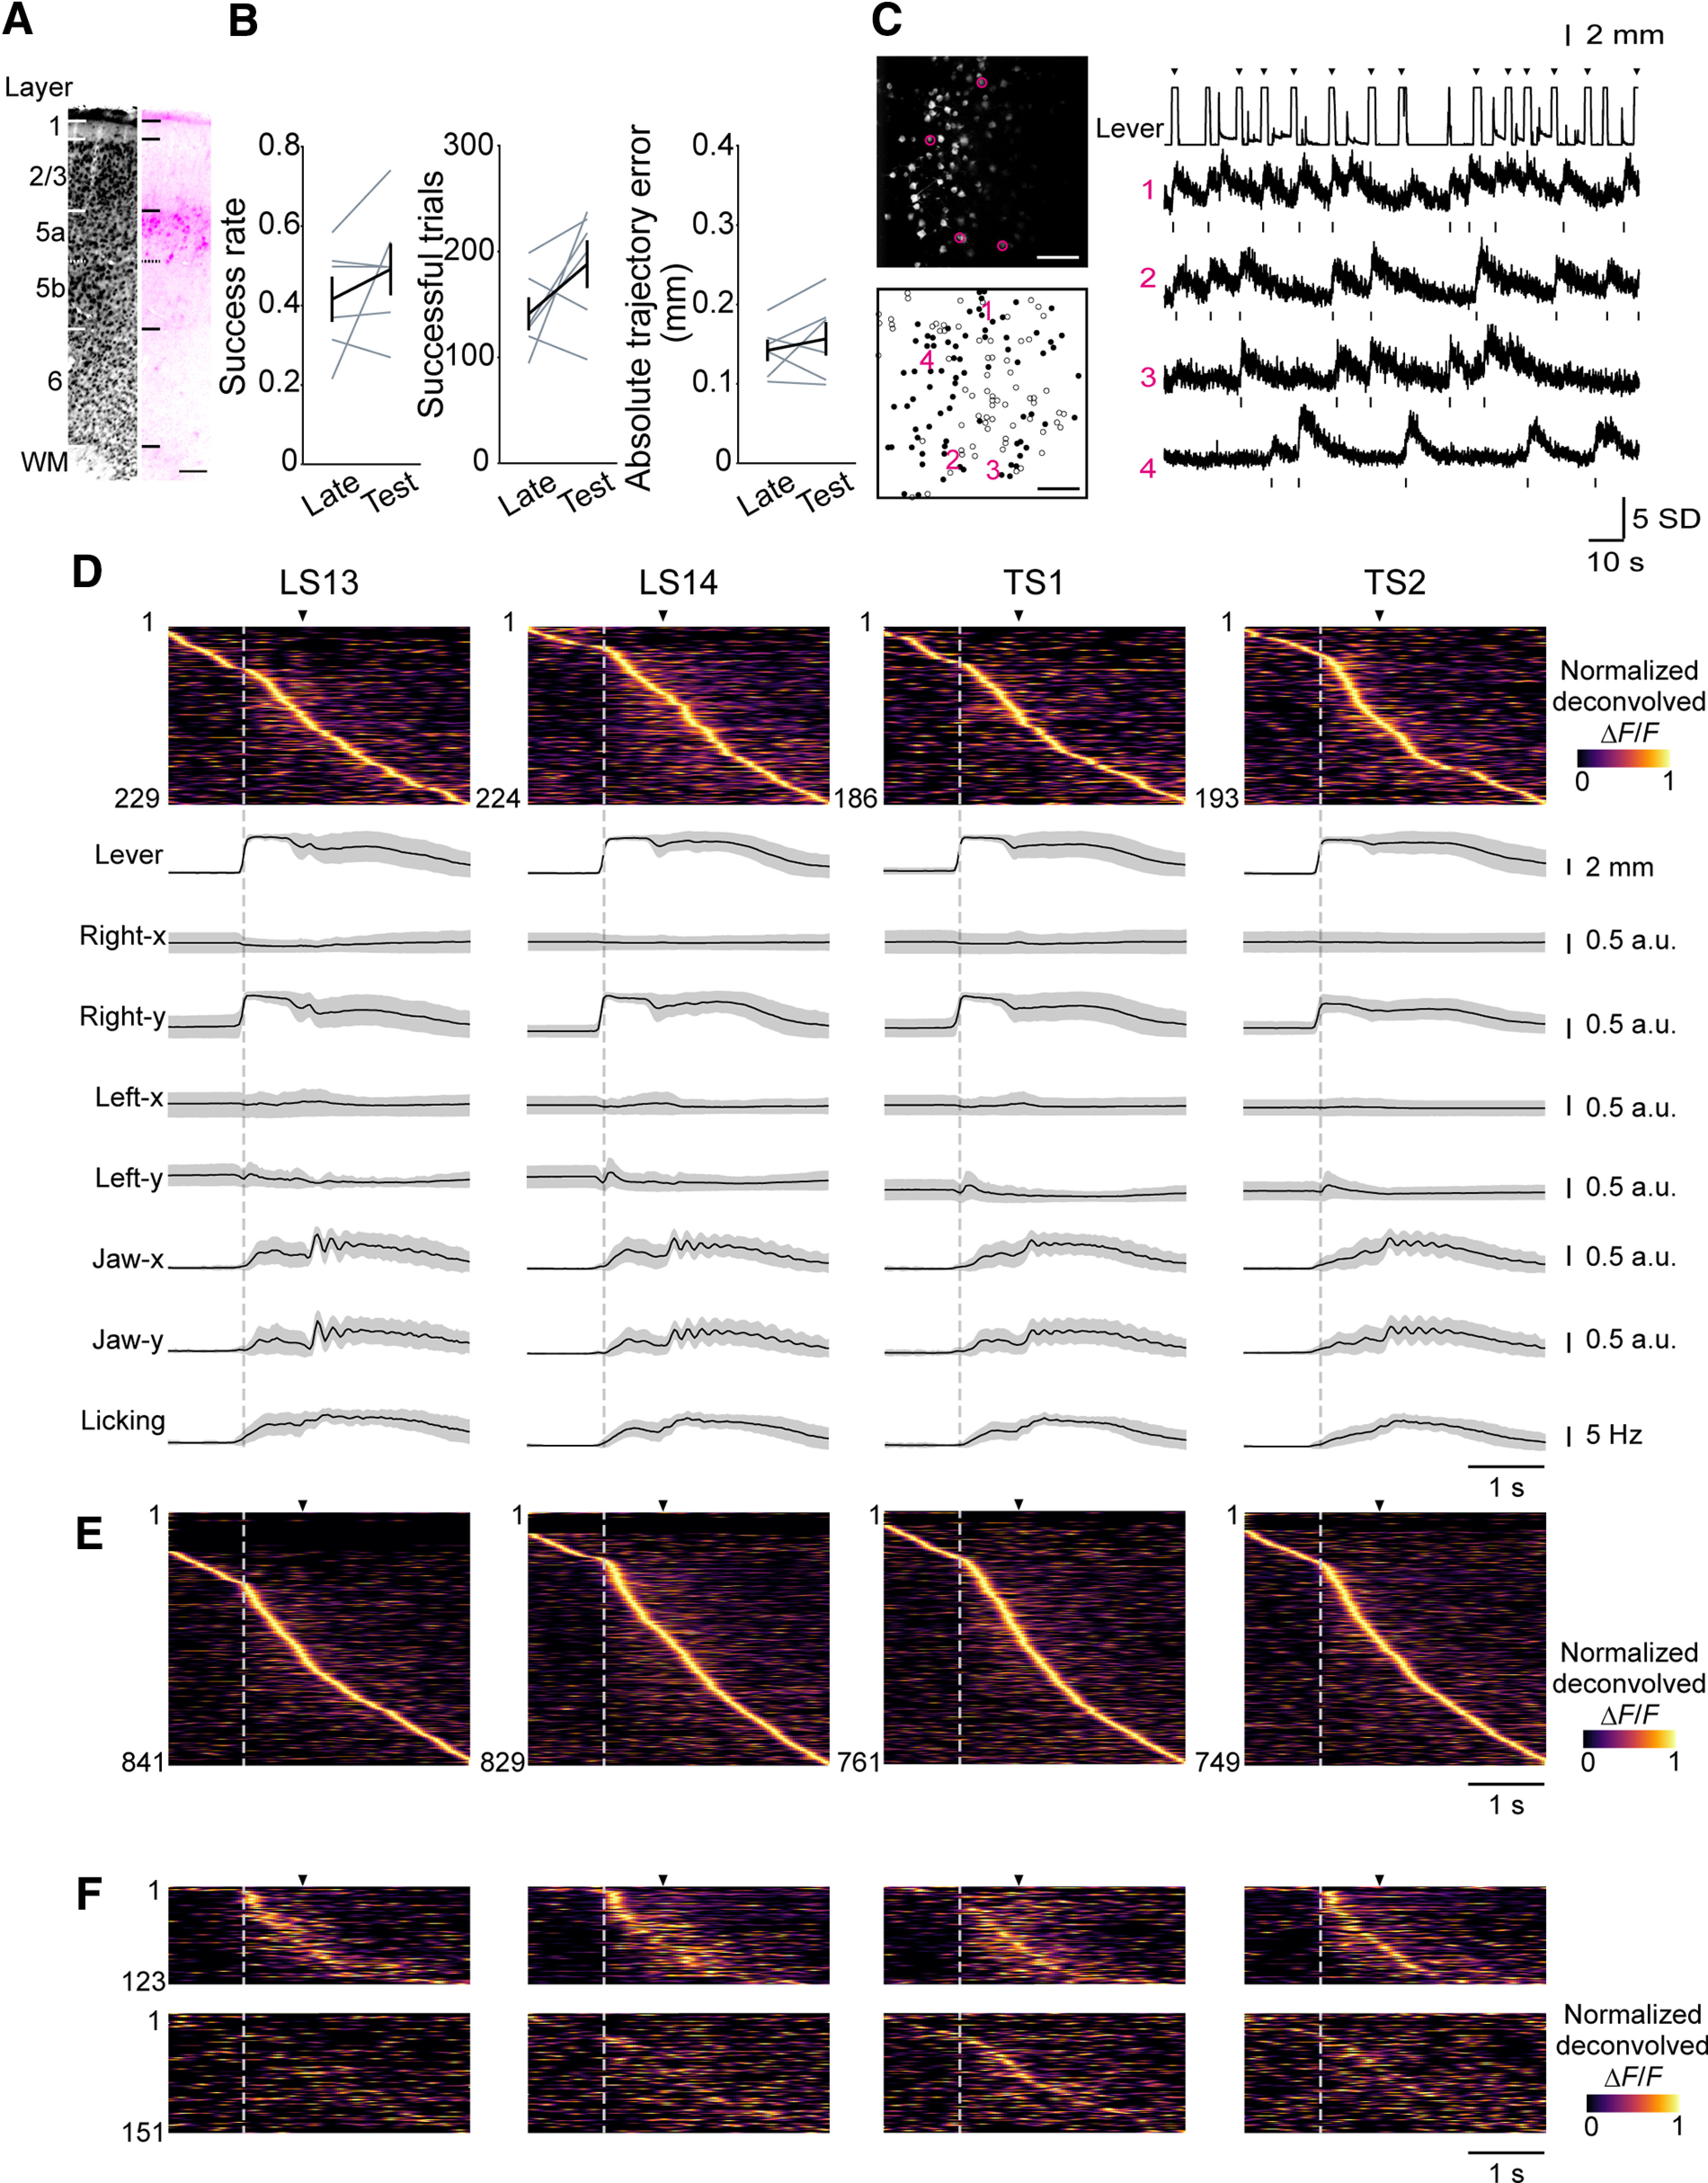
Figure 3.

Longitudinal two-photon calcium imaging of CFA L5 IT neurons. A, Histological image of jRGECO1a expressed in a representative Tlx3-Cre mouse. Left, Neurons labeled with NeuroTrace. Right, Neurons expressing jRGECO1a. Scale bar, 100 µm. WM, white matter. B, A summary of task performance in the late learning sessions (LS13 and LS14) and test sessions (TS1 and TS2). Left, Mean success rate, p = 0.27 by paired t test. Middle, Mean number of successful trials, p = 0.14 by paired t test. Right, Mean absolute trajectory errors in successful trials of the expert lever trajectory at 0.6 s from the lever-pull initiation, p = 0.42 by paired t test, n = 6 mice. C, Left, Frame-averaged two-photon image of L5a IT neurons expressing jRGECO1a in the CFA from a representative mouse (top). ROIs extracted by the CaImAn algorithm. Left, Neurons tracked throughout the imaging sessions (pursued neurons) are shown as black circles, and other neurons are shown as white circles (bottom). Scale bar, 100 µm. Right, Representative lever trajectories and ΔF/F traces of neurons 1–4 in the left images. Frames with the deconvolved calcium activity are shown in raster plots below each trace. Arrowheads indicate the reward timings. D, Trial-averaged deconvolved calcium traces (normalized) of CFA L5a IT neurons and movements of body parts (lever, right forelimb, left forelimb, jaw, and licking) from a representative mouse aligned to lever-pull initiation of successful trials (gray dotted line). Arrowheads indicate reward timings. E, Trial-averaged deconvolved calcium traces (normalized) of CFA L5a IT neurons pooled from six mice and aligned to the lever-pull initiation of successful trials. F, Trial-averaged deconvolved calcium traces (normalized) of CFA L5a IT pursued neurons aligned to the lever-pull initiation of successful trials (n = 274 cells from 6 mice). Top, The mean sorted deconvolved calcium traces (normalized) of the fraction of pursued neurons whose mean correlation of trial-averaged deconvolved calcium traces (normalized) across imaging sessions was higher than that of the 95th percentile of random shuffling (the 95th percentile of the correlation coefficient was 0.136, n = 123 neurons). Bottom, The mean sorted deconvolved calcium traces (normalized) of the remaining fraction of pursued neurons (n = 151 neurons). The order of neurons is the same across sessions.
