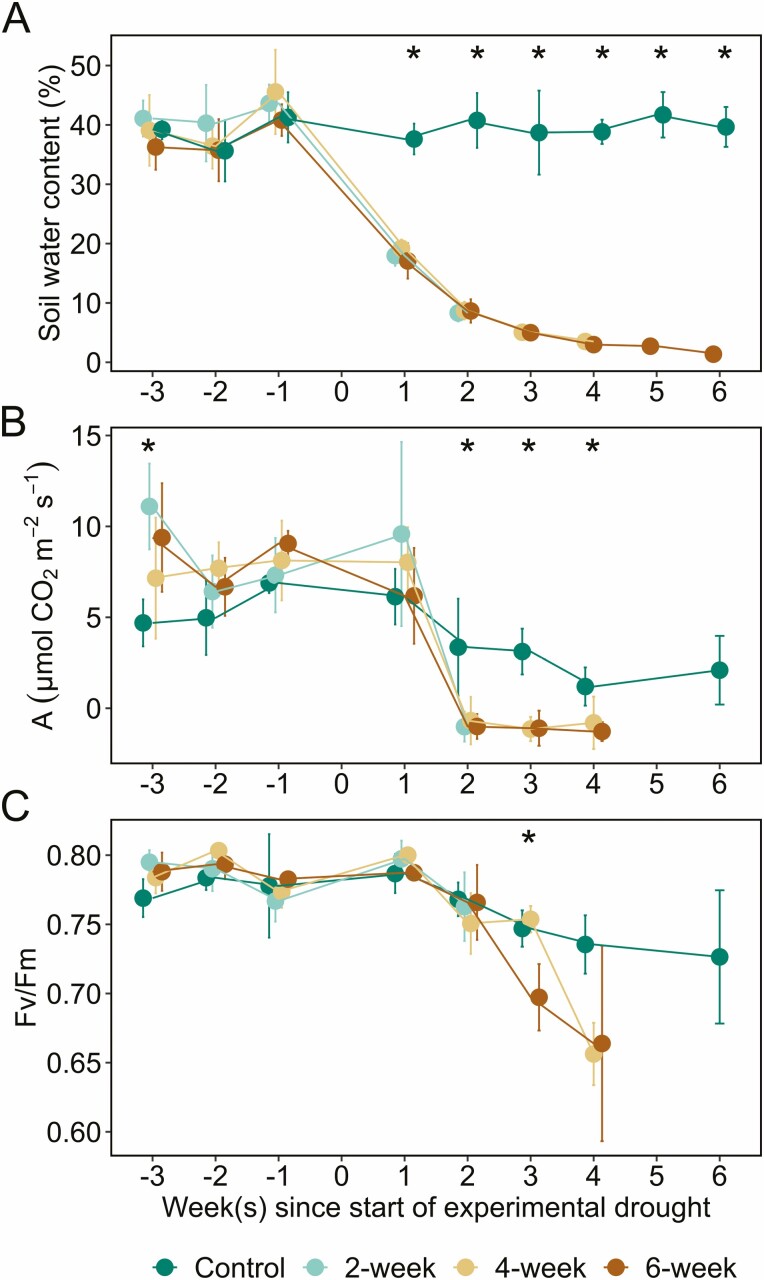
Figure 1.
Environmental and physiological parameters measured before and during the experimental drought for four treatment groups. The parameters measured were (A) soil water content, (B) assimilation (A), and (C) chlorophyll fluorescence (Fv/Fm). Zero marks the start of the experimental drought. Measurements were collected from all treatments for three weeks leading up to the start of the drought and then each group was measured for 2, 4 or 6 weeks of drought, respectively, with the well-watered control group measured for 6 weeks. The lack of data for the 6-week drought group beyond week 4 in (B) and (C) was due to the plants no longer having healthy leaves for measurement [seeSupporting Information—Fig. S1]. Error bars denote ± 1 SD of the mean. An asterisk indicates treatment groups significantly differed from each other at a given timepoint based on Tukey’s honest significant difference (HSD) at α = 0.05.

