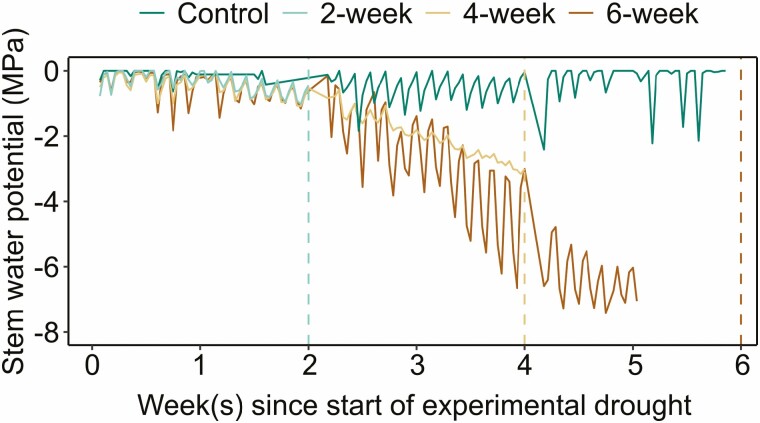
Figure 2.
Stem water potential (in MPa) measured using ICT stem psychrometers throughout the experimental drought for four treatment groups. Vertical dashed line indicates point of harvest for each treatment, coloured by treatment. The 2-week drought group was measured for 2 weeks and then harvested, the 4-week drought group was measured for 4 weeks and then harvested, and the 6-week drought group and well-watered control group were measured for 6 weeks and then harvested. The lack of data for the 6-week drought group between weeks 5 and 6 was due to a datalogger malfunction. Data shown are daily measurements at 0:00, 6:00, 12:00 and 18:00. Hourly measurements for each treatment are displayed in Supporting Information—Fig. S7.

