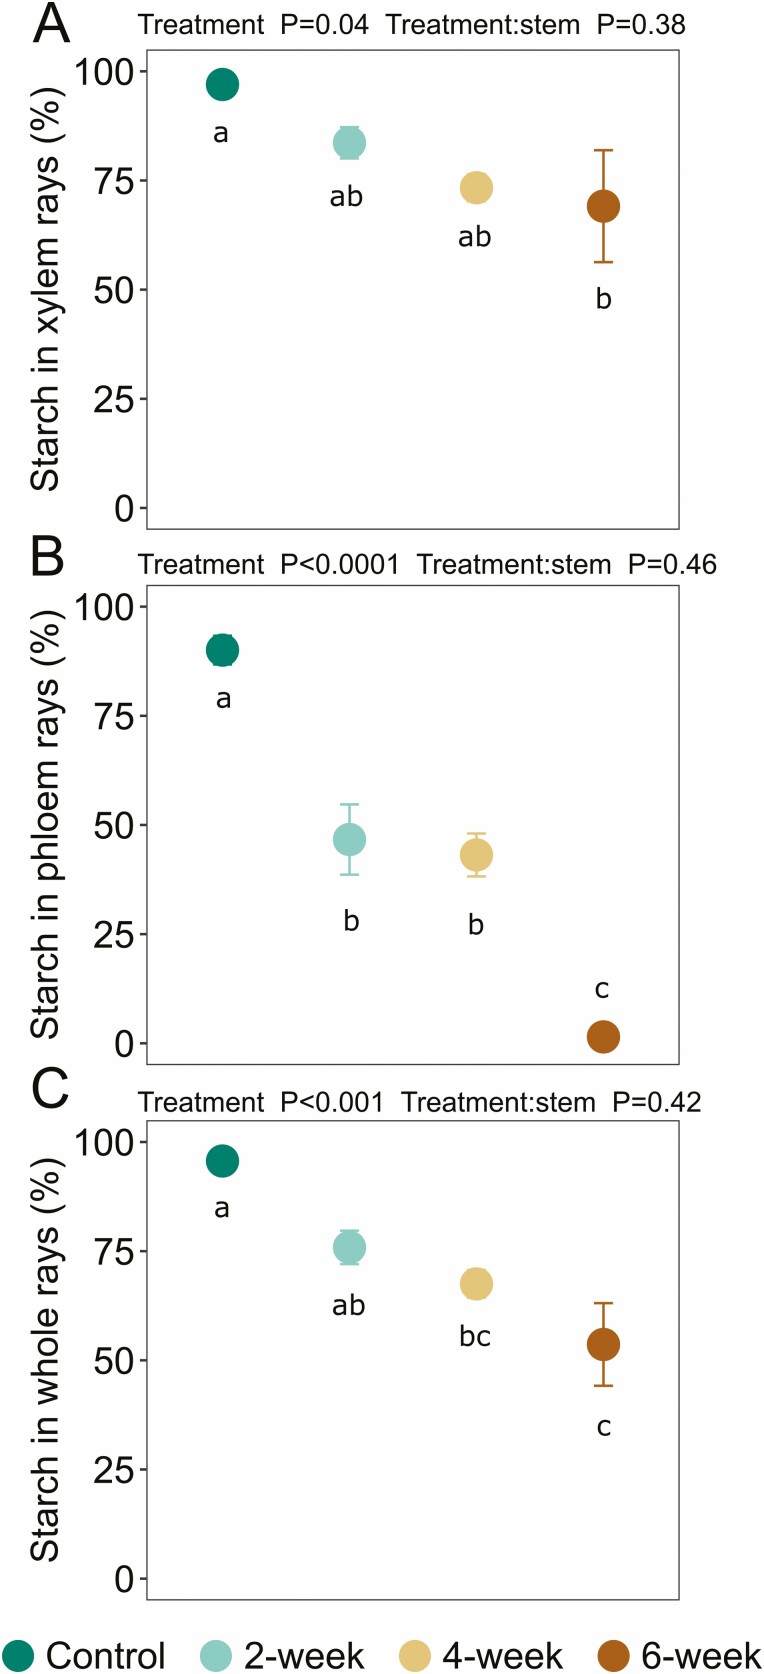
Figure 3.
Iodine-stained starch (%) in (A) xylem ray parenchyma, (B) phloem ray parenchyma and (C) whole rays following sequential harvesting. Data were averaged over two stem locations, 10 and 50 % of the total plant length above the soil surface. The 2-week drought group underwent drought for 2 weeks and then was harvested and stained for starch, and so on for each drought group. The well-watered control group was maintained under well-watered conditions for 6 weeks and then was harvested and stained for starch. Error bars denote ± SE of the mean. In some cases, error bars are smaller than the point. Statistical results displayed above plots are from nested one-way ANOVA testing with stem location treated as technical replicates per plant (treatment:stem) and lowercase letters within the plots indicate whether treatments significantly differed from each other based on Tukey’s honest significant difference (HSD) at α = 0.05. Data for each stem location are provided in Supporting Information—Fig. S3. Data are provided in Supporting Information—Table S1.

