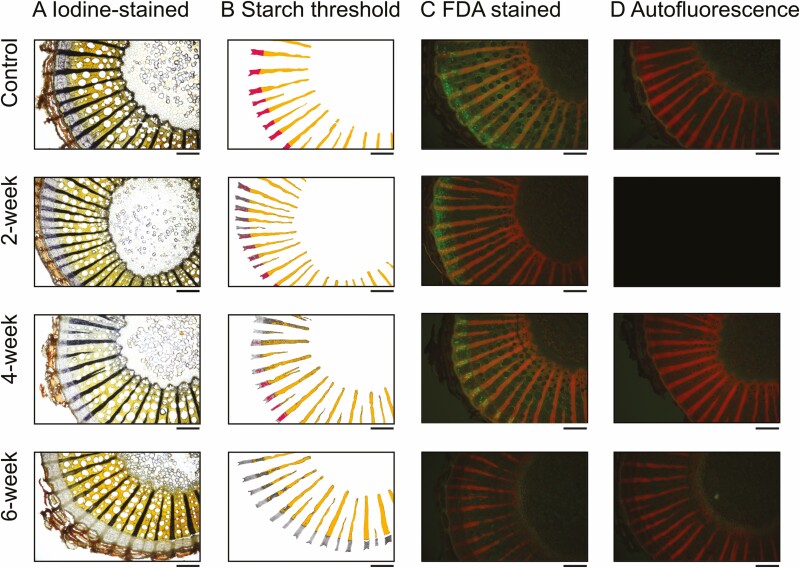
Figure 4.
Visualization of (A) starch content and (C) metabolically active/viable cells in the stem of a representative plant from each treatment group throughout drought. Iodine-stained starch was visualized with compound light microscopy and then iodine-stained starch was identified in the xylem (orange) and phloem (pink) ray parenchyma via thresholding in ImageJ in (B). Quantification of this starch thresholding as percent starch for all plants is displayed in Fig. 3. Additionally, fluorescent living cells following FDA staining were visualized with fluorescent microscopy in (C) and autofluorescence was visualized with water in (D). Viable cells take up the stain and emit green in (C). Black box indicates missing image. Images displayed are from stem samples collected at 10 % above the soil and are from one plant per treatment (plant IDs 007, 012, 008, 005, respectively). Images for all plants are displayed in Supporting Information—Fig. S8. Scale bar = 0.5 mm.

