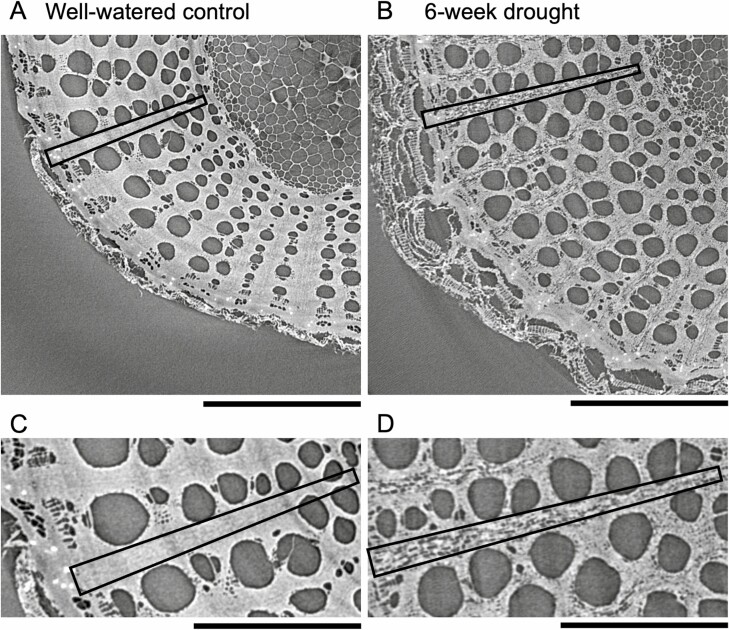
Figure 6.
Visualization of starch in the xylem ray parenchyma of the stem in a representative (A, C) well-watered control group plant and (B, D) 6-week drought group plant using X-ray microcomputed tomography (microCT) imaging. In each stem, a single ray is outlined with a box to illustrate that in A and C the ray parenchyma is filled with starch granules and appears bright grey in colour, whereas in B and D the dark grey and black pixels within the ray parenchyma show that the ray is depleted of starch; C and D are zoomed in on the same rays outlined in A and B to show more detail. Since the stems were dried prior to microCT imaging, other tissues in the stem are no longer water-filled and thus appear dark grey (e.g. vessels and pith). Usually water-filled regions appear light grey, so drying samples improves the ability to distinguish starch from other structures. Plants imaged were plant IDs 002 and 006, respectively, and stem samples for microCT imaging were collected at 10 % of the total plant length above the soil surface. Scale bar in A and B = 1 mm, scale bar in C and D = 0.5 mm.

