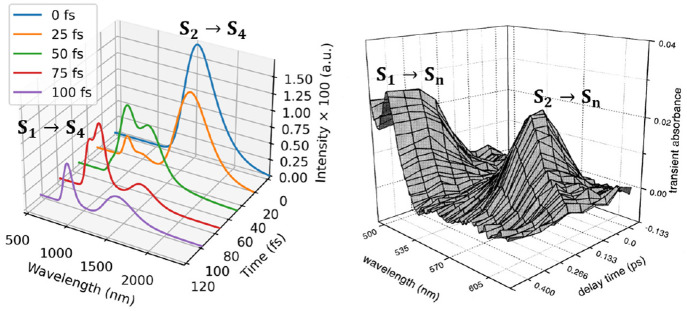
Figure 13.
Computed (left) and experimental (right) TA spectra of pyrene in the gas phase. Band origins of S1 and S2 were shifted by −0.42 and −0.02 eV, respectively. Experimental spectra reprinted from ref (278). Copyright 1999 Hindawi Publishing Corporation. Distributed under a CC-BY license.

