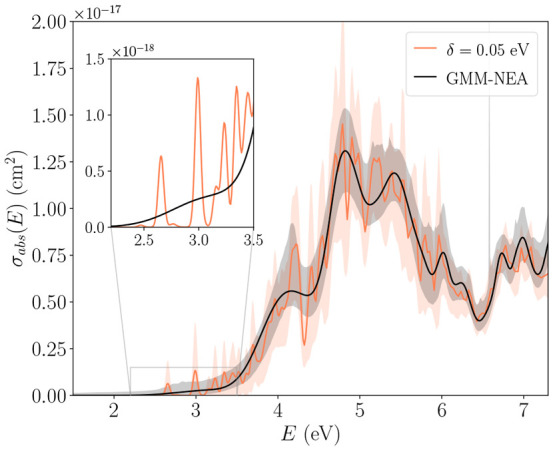
Figure 24.

Electronic absorption cross section spectrum σabs(E) of HgBrOOH reconstructed from 200 geometries using a unique empirical bandwidth of δ = 0.05 eV for all transition (orange line) and GMM-NEA (black line). The shaded areas represent the 95% confidence intervals. The inset details the contribution of both spectra in the region overlapping with the solar radiation (not shown).
