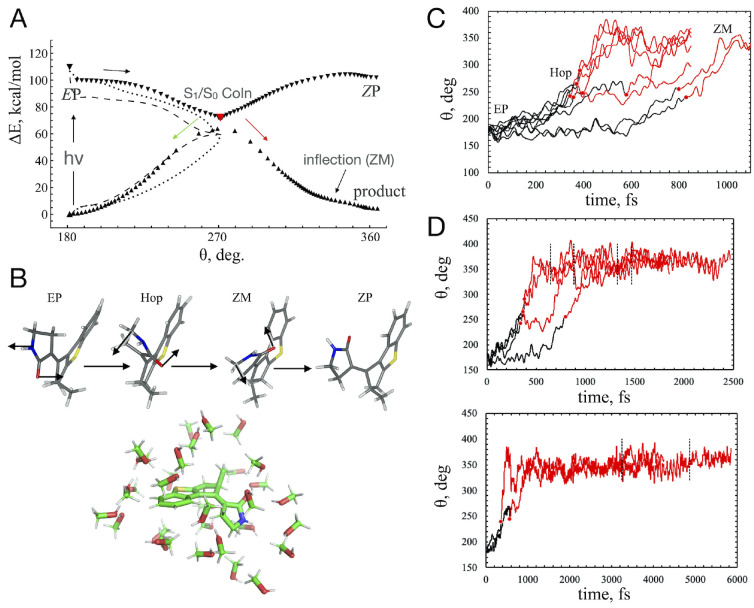
Figure 30.
Simulations of EP → ZM → ZP half-cycle of MTDP. (A) Minimum energy path EP → ZP of the MTDP motor θ (the torsion angle defining the position of rotor with respect to stator) calculated with the SSR method (triangles). The dashed energy profiles correspond to 3-root state-average XMS-CASPT2 energies calculated with a 2 electrons in 2 π-orbitals complete active space. The dotted energy profiles show the corresponding 5-root state-average with a 10 electrons in 10 π-orbitals complete active space. (B) The top panel summarizes the conformational changes of MTDP in solvent along the QM/MM trajectories. The bottom panel shows the flexible part of the MTDP in methanol QM/MM model. (C) Simulated photoisomerization of MTDP in methanol solution based on 8 productive trajectories observed using 40 initial conditions with EP-helicity character. The propagation along the S1 PES (the black lines) is connected with the reactive propagation along the S0 PES (the red lines) by the corresponding hop points (the red circles). (D) Picosecond-scale simulation of MTDP photoisomerization in methanol solution as demonstrated through 8 reactive CCW trajectories. The top panel shows 4 trajectories in which EP to ZP transition occurs within 2.5 ps. The bottom panel demonstrated 2 trajectories in which EP to ZP transition occurs within 6 ps. The propagation along the S1 PES is shown with solid black lines, while the propagation along S0 is shown with solid red lines. The hop points are marked with red circles. The point of trajectory at which ZP conformer becomes stable is identified with vertical dashed black lines.

