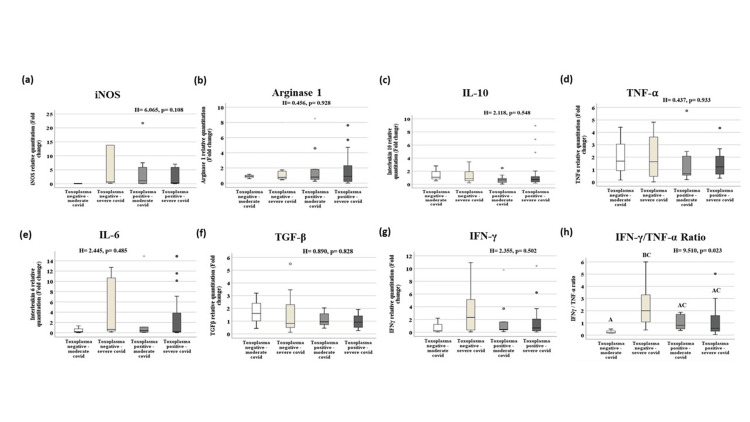
Figure 3. Gene expression of the studied genes in Toxoplasma negative and Toxoplasma positive moderate and severe groups by quantitative real-time PCR.
All immune markers expressed non-significant changes in the four studied groups. Only the IFN- γ/TNF-α ratio displayed a significant increase in the Toxoplasma negative severe group compared to the Toxoplasma negative moderate group (p = 0.02) (h). Data are presented as median (interquartile range) of gene expression fold changes, p-value by Kruskal-Wallis H test. Pairwise comparison when p is significant is presented as capital letters; similar letters = statistically insignificant difference, different letters = statistically significant difference.

