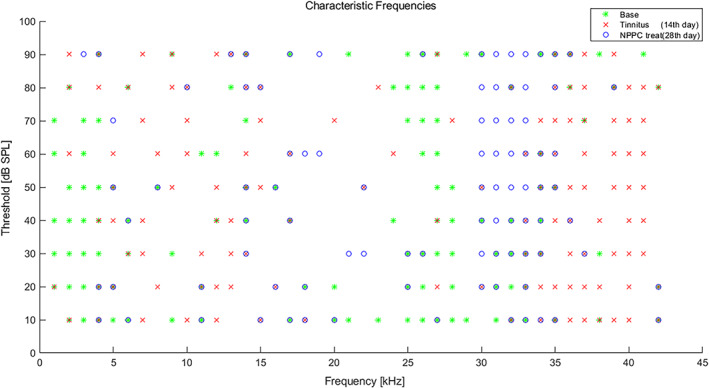
FIGURE 3.

Characteristic frequencies (CFs) and MGB unit thresholds at baseline, 14th and 28th day: scatter plot of individual MGB unit thresholds at their CFs from the base (green) and 14th (red) and 28th days (blue) rats. The average threshold at CFs of MGB unit recording in three situations (Base, 14th and 28th days) did not exhibit any significant difference (p > .05).
