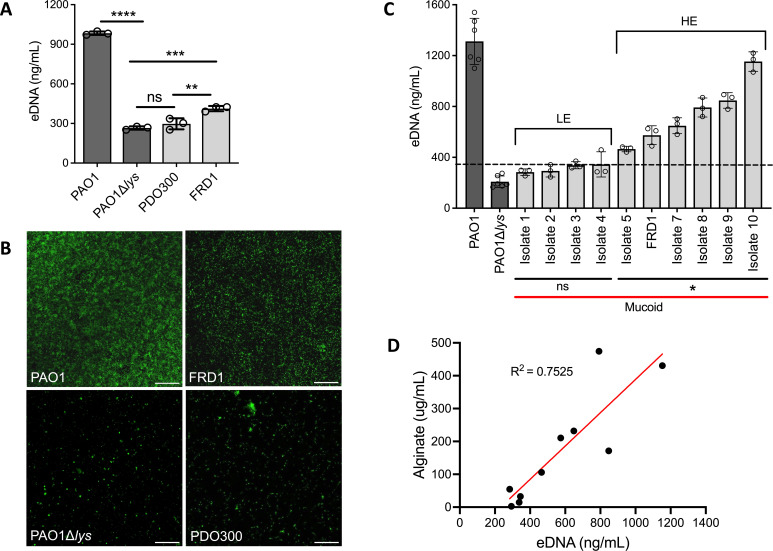
Fig 1.
eDNA abundance is diverse across clinical mucoid isolates. Fluorometric quantification of eDNA isolated from colony biofilms of nonmucoid (dark gray) PAO1, eDNA mutant PAO1∆lys, and mucoid (light gray) laboratory-derived PDO300 and clinical strain FRD1 (A). Representative images of TOTO-1 eDNA stained 48 h static biofilms of corresponding mucoid and nonmucoid strains; 20x objective, scale bar: 100 µm (B). Quantification of eDNA isolated from colony biofilms of 10 clinical mucoid isolates. The dashed line indicates +3 standard deviations above the eDNA mutant (PAO1∆lys) average (345 ng/mL). The “ns” bar indicates strains with eDNA concentrations comparable to the eDNA mutant, hence, low eDNA (LE). The “*” bar indicates strains with eDNA levels significantly higher than the eDNA mutant, hence, high eDNA (HE) (C). R2 correlation measurement of alginate and eDNA concentrations of the 10 clinical mucoid strains. (D). Each dot represents the average of three technical from three biological replicates of each strain. Analyzed using one-way ANOVA **P < 0.005, ***P < 0.0005, ****P < 0.0001.

