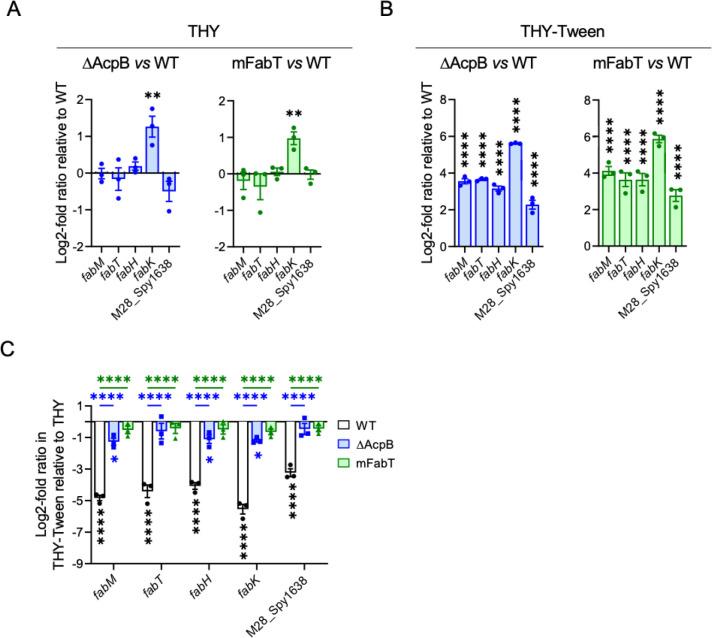
Fig 1.
The ΔAcpB strain has lost most of the eFA-related transcriptional repression capacity. WT, ΔAcpB, and mFabT strains were grown in THY (A, C) or THY-Tween (B, C), and RNAs were quantified by qRT-PCR. Expression was normalized to that of gyrA; relative gene expression is expressed as the log2-fold ratio in ΔAcpB vs WT strain (right, A and B) and mFabT vs WT strain (left, A and B). (C) The relative gene expression is expressed as the log2-fold ratio in a given strain grown in THY-Tween vs in THY. White, WT; blue, ΔAcpB; green, mFabT. Significance of differences: stars below bars, in the two media for a given strain; stars above bars, in the two media between WT and ΔAcpB or WT and mFabT. No statistically significant differences were found between ΔAcpB and mFabT. N = 3. Two-way ANOVA, Bonferroni post-test, *P < 0.05, **P < 0.01, and ****P < 0.0001.

