Figure 2. Single-Particle Image Analysis.

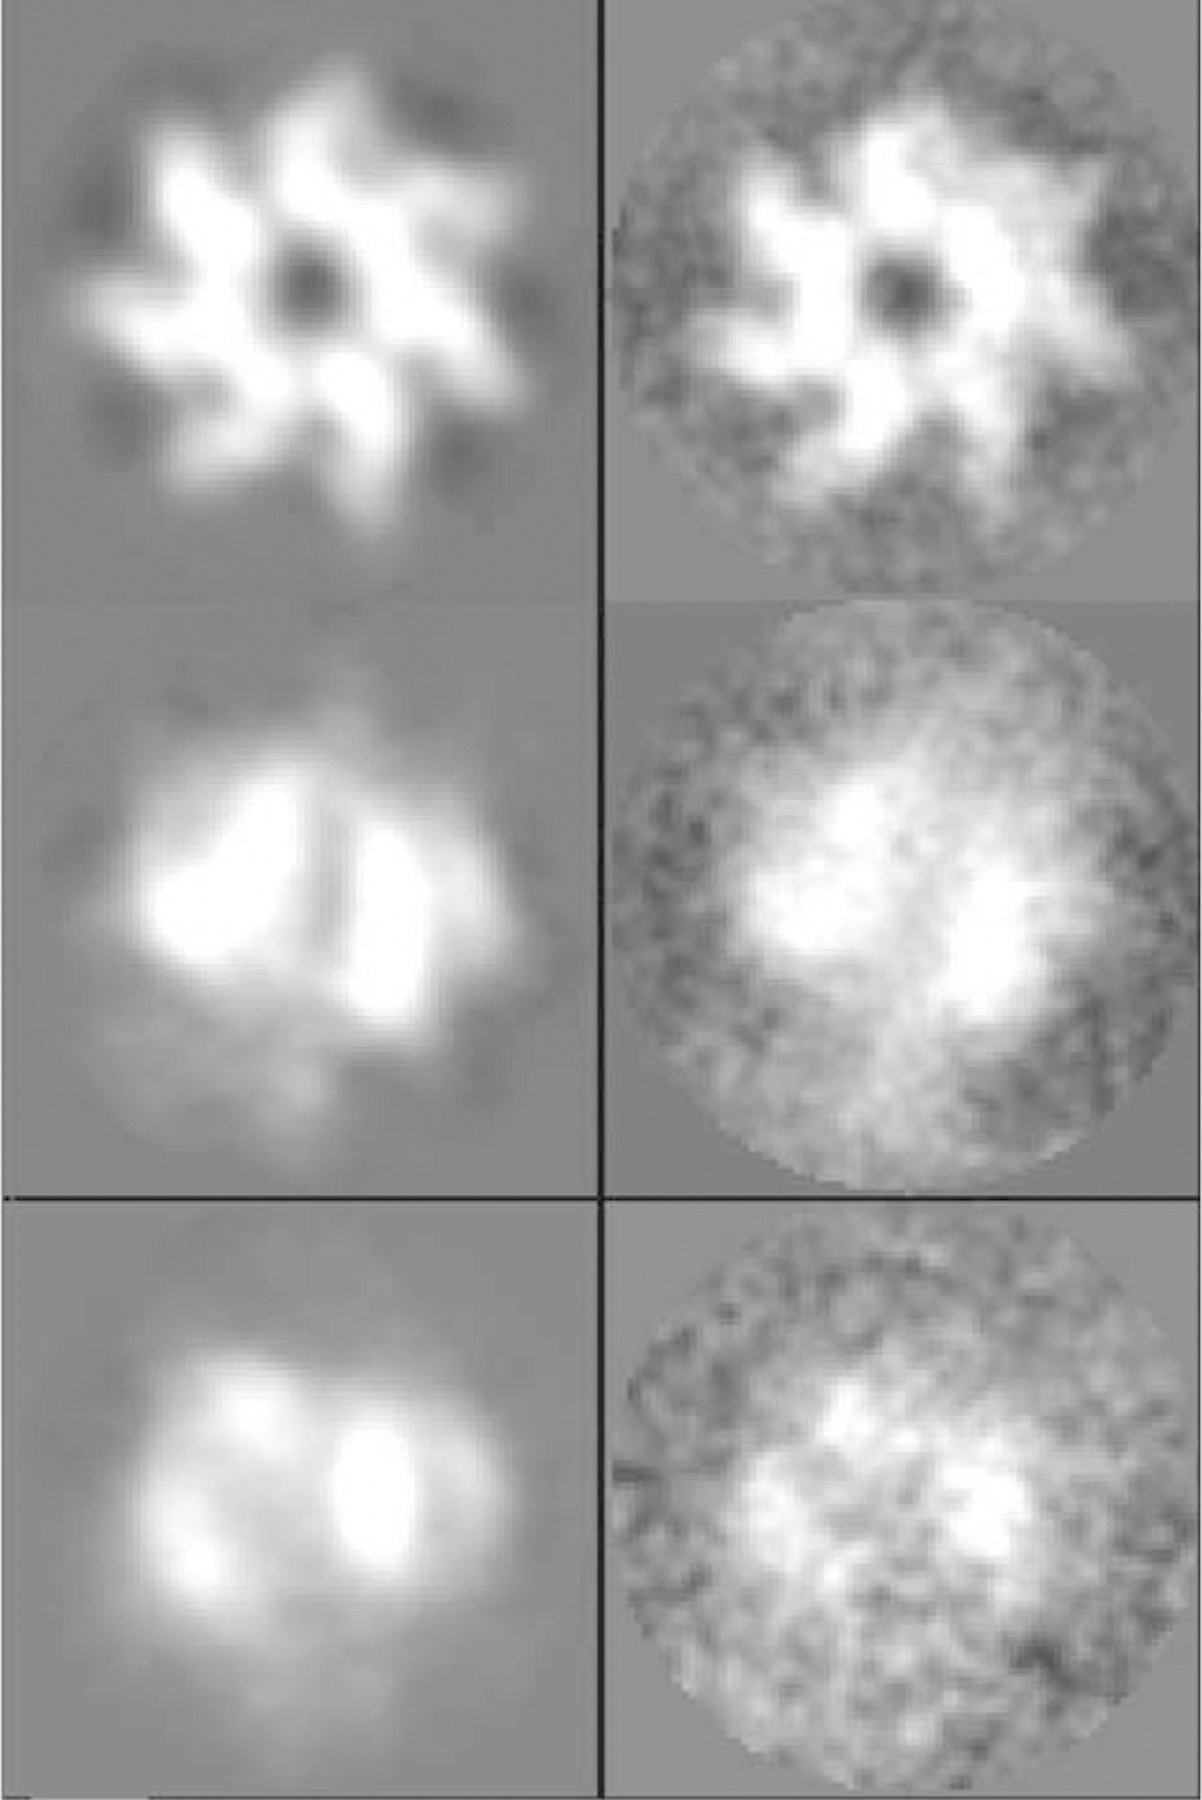
Class averages (left panel) and raw particle images (right panel) for three example views of the PA63h.LF complex that were in the set included in the 3D reconstruction.

Class averages (left panel) and raw particle images (right panel) for three example views of the PA63h.LF complex that were in the set included in the 3D reconstruction.