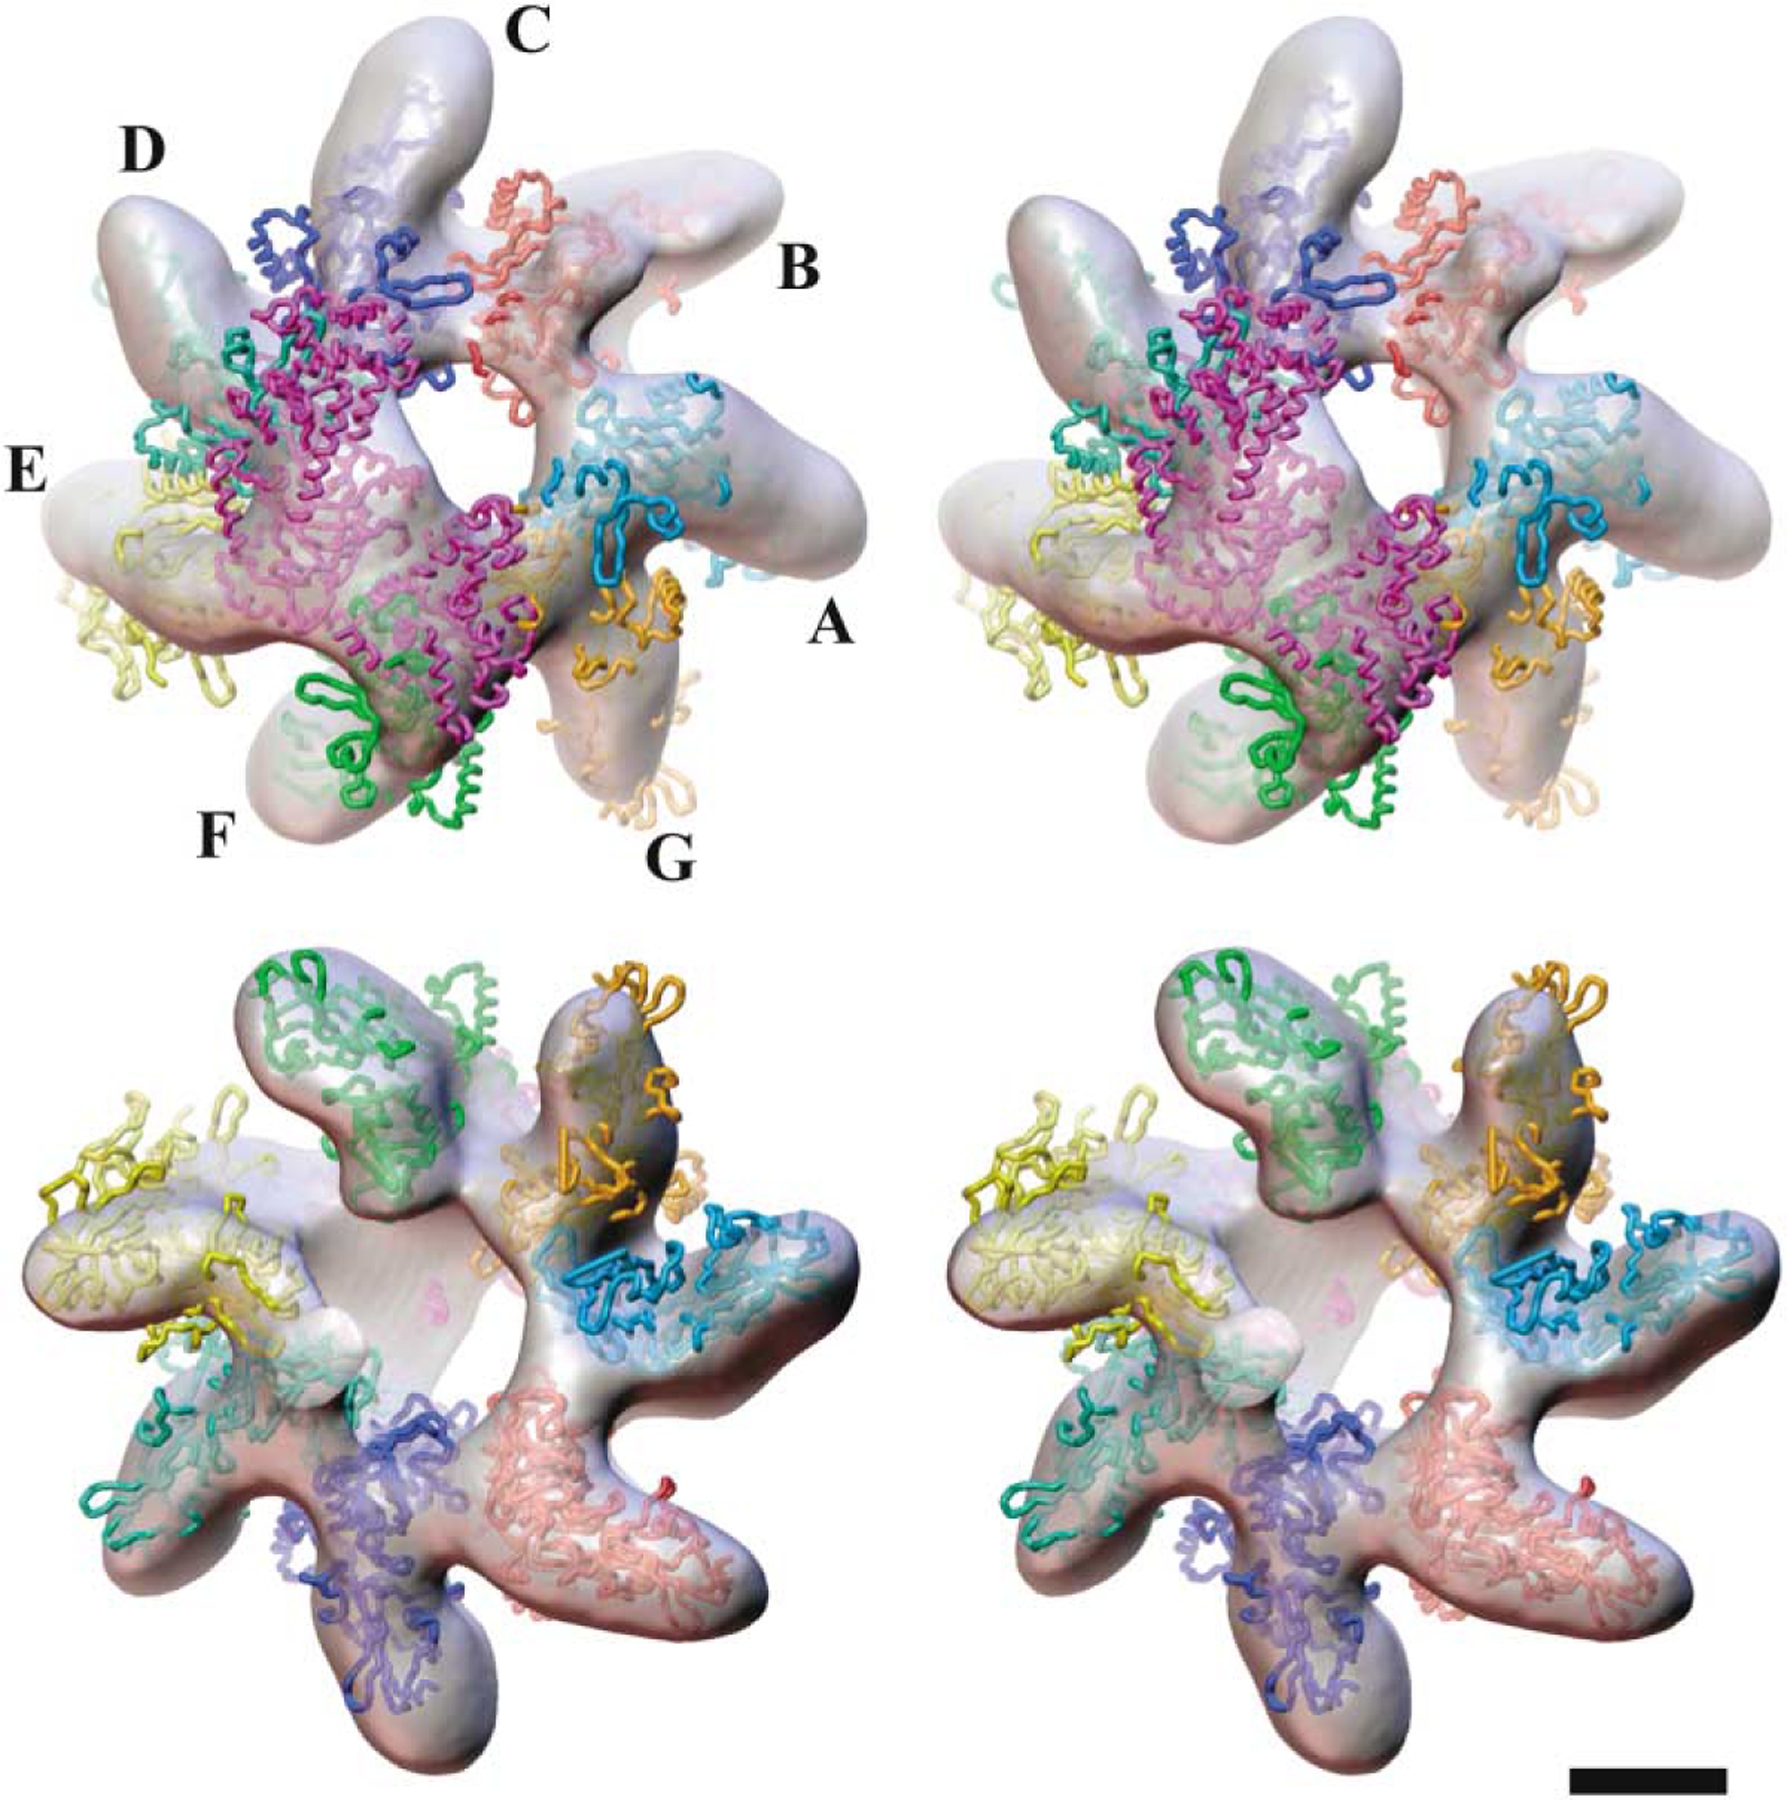
Figure 4. Docked Atomic Model of the Complex.

Stereo views of the atomic model of the complex of the heptamer (PA63h: A–G) and lethal factor (LF) docked into the 3D reconstructed density map of the PA63h.LF complex viewed from the nonmembrane-interacting (top pair) and the membrane-interacting (bottom pair) faces, respectively. The ligand molecule LF is shown in purple. This illustration was created by using AVS (Upson et al., 1989) software. (Bar = 50 Å ).
