Figure 2.

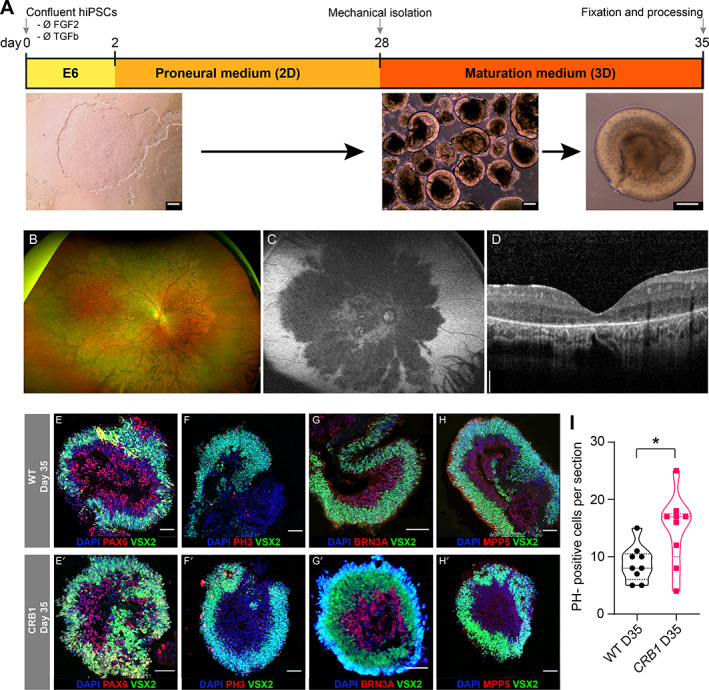
Retinal organoids of a CRB1 patient. Clinical retinal imaging of a patient with CRB1‐LCA8 and generation of ROs from patient‐derived hiPSC. (A) Schematic of retinal differentiation 2D/3D protocol from hiPSC. (B) Fundus photograph, (C) fundus autofluorescence, and (D) retinal imaging using spectral domain‐optical coherence tomography of right eye of patient with CRB1‐LCA8. The nasal outer macula subfield was 414 μm thick with no signs of any oedema. Immunostaining images of WT and CRB1 RO sections at day 35 for (E) PAX6/VSX2, (F) PH3/VSX2, (G) BRN3A/VSX2, and (H) MPP5/VSX2 expression. (I) Quantification of PH3‐positive cells per section analysed; * p < 0.02. Scale bars: A, 100 μm; D, 200 μm; E–H, 50 μm.
