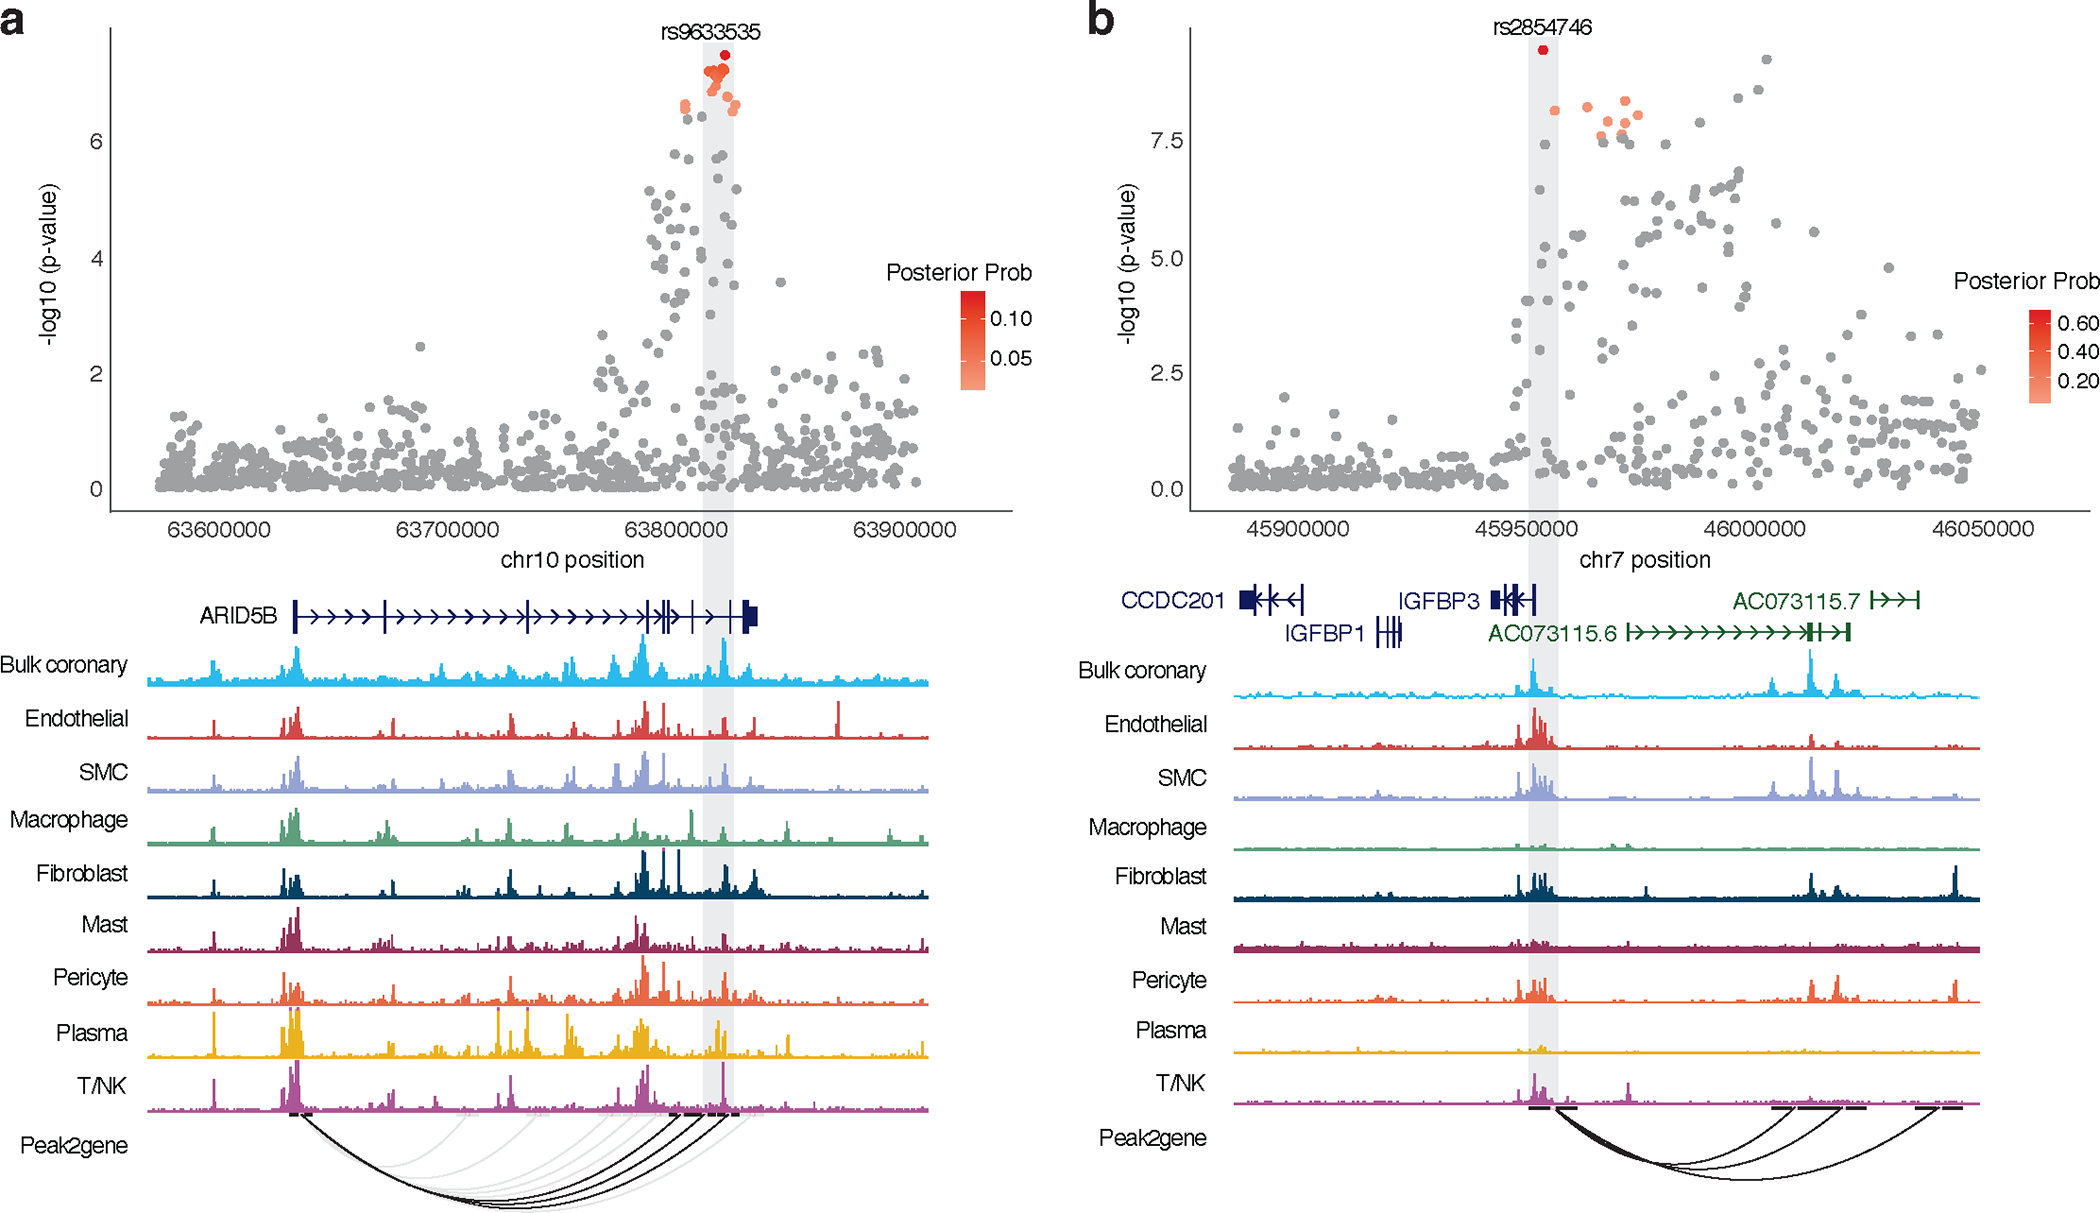
Figure 3 |. Single-nucleus coronary epigenomic annotation of ARID5B and IGFBP3 CAC loci.

a,b, Top, ARID5B (a) and IGFBP3 (b) locus association plots showing CAC meta-analysis results in European and African American ancestry individuals with credible set SNPs color coded by posterior probability (red). Meta-analysis P-values determined from weighted Z-scores in fixed effects model and central association P-values determined from chi-square test statistic. Bottom, overlapping chromatin accessibility profiles in coronary artery cell types determined by bulk and single-nucleus ATAC-seq. Peak2gene links highlight predicted enhancer promoter interactions across all cell types with those overlapping CAC SNPs shown in black. Light grey box highlights lead SNP at each locus. SMC, smooth muscle cells; T/NK: T-cells or natural killer cells.
