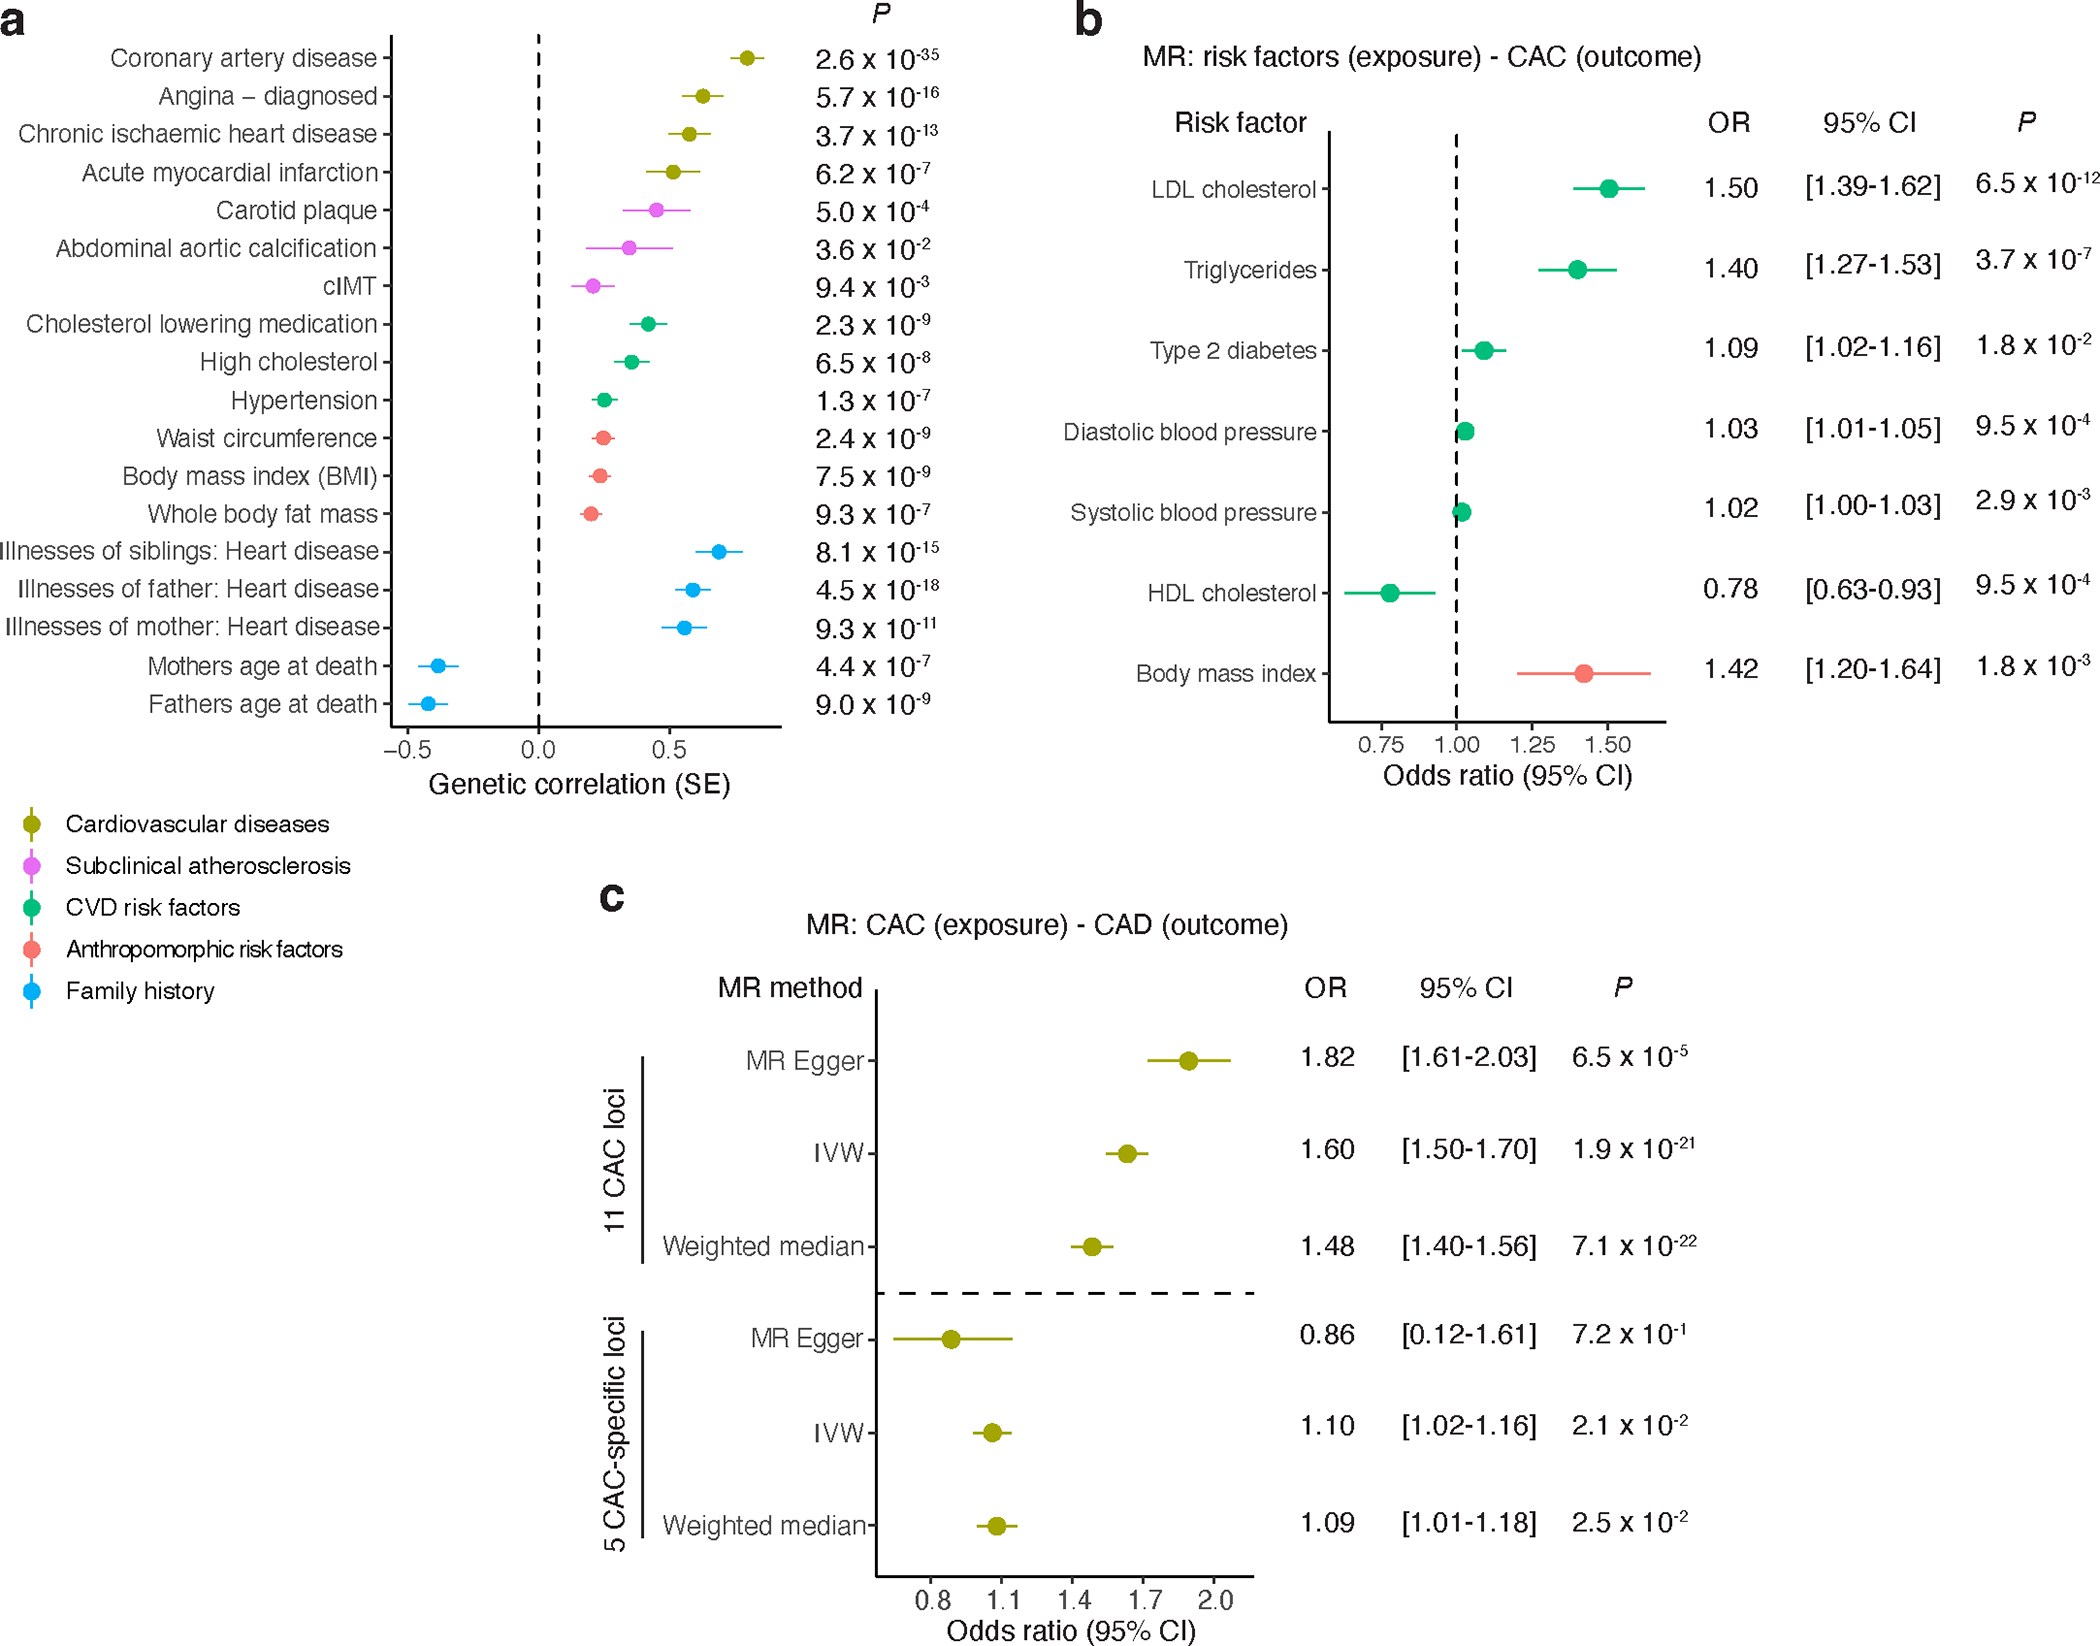
Figure 4 |. Genetic correlations for CAC and Mendelian randomization for cardiovascular disease risk factors.

a, Cross-trait LD-score regression-based genetic correlation of CAC quantity with cardiovascular disease risk factors, anthropomorphic risk factors, family history, subclinical and clinical cardiovascular disease using European ancestry CAC and UK Biobank trait associations. Vertical dashed line set at genetic covariance = 0. Values represent the genetic correlation estimates using the slope from the regression of the product of Z-scores from two GWAS studies on the LD score and error bars represent the standard error estimates of the LD score. P-values (two-tailed) are computed from chi-square test statistics. b, Mendelian randomization (MR) results showing causal effects of cardiovascular disease and anthropomorphic risk factors on CAC quantity using the inverse variance-weighted method (IVW). Values represent the mean odds ratio and error bars reflect the 95% confidence intervals. P-values (two-tailed t test) < 7.14 × 10⁻³ (0.05/7) are considered statistically significant. Vertical dashed line set at odds ratio = 1.0. c, MR results showing causal effects of CAC quantity on coronary artery disease (CAD) using either 16 independent lead SNPs at the 11 CAC loci or 5 lead SNPs from the 5 CAC-specific loci (separated by horizontal dashed line). Values represent the mean odds ratio and error bars reflect the 95% confidence intervals. P-values (two-tailed t test) < 0.05 are considered statistically significant. Different MR methods used are shown, including MR-Egger, IVW, and Weighted median. Sample sizes for a-c are provided in Supplementary Tables 15 and 16. LDL, low-density lipoprotein; HDL, high-density lipoprotein; cIMT: carotid intima-media thickness.
