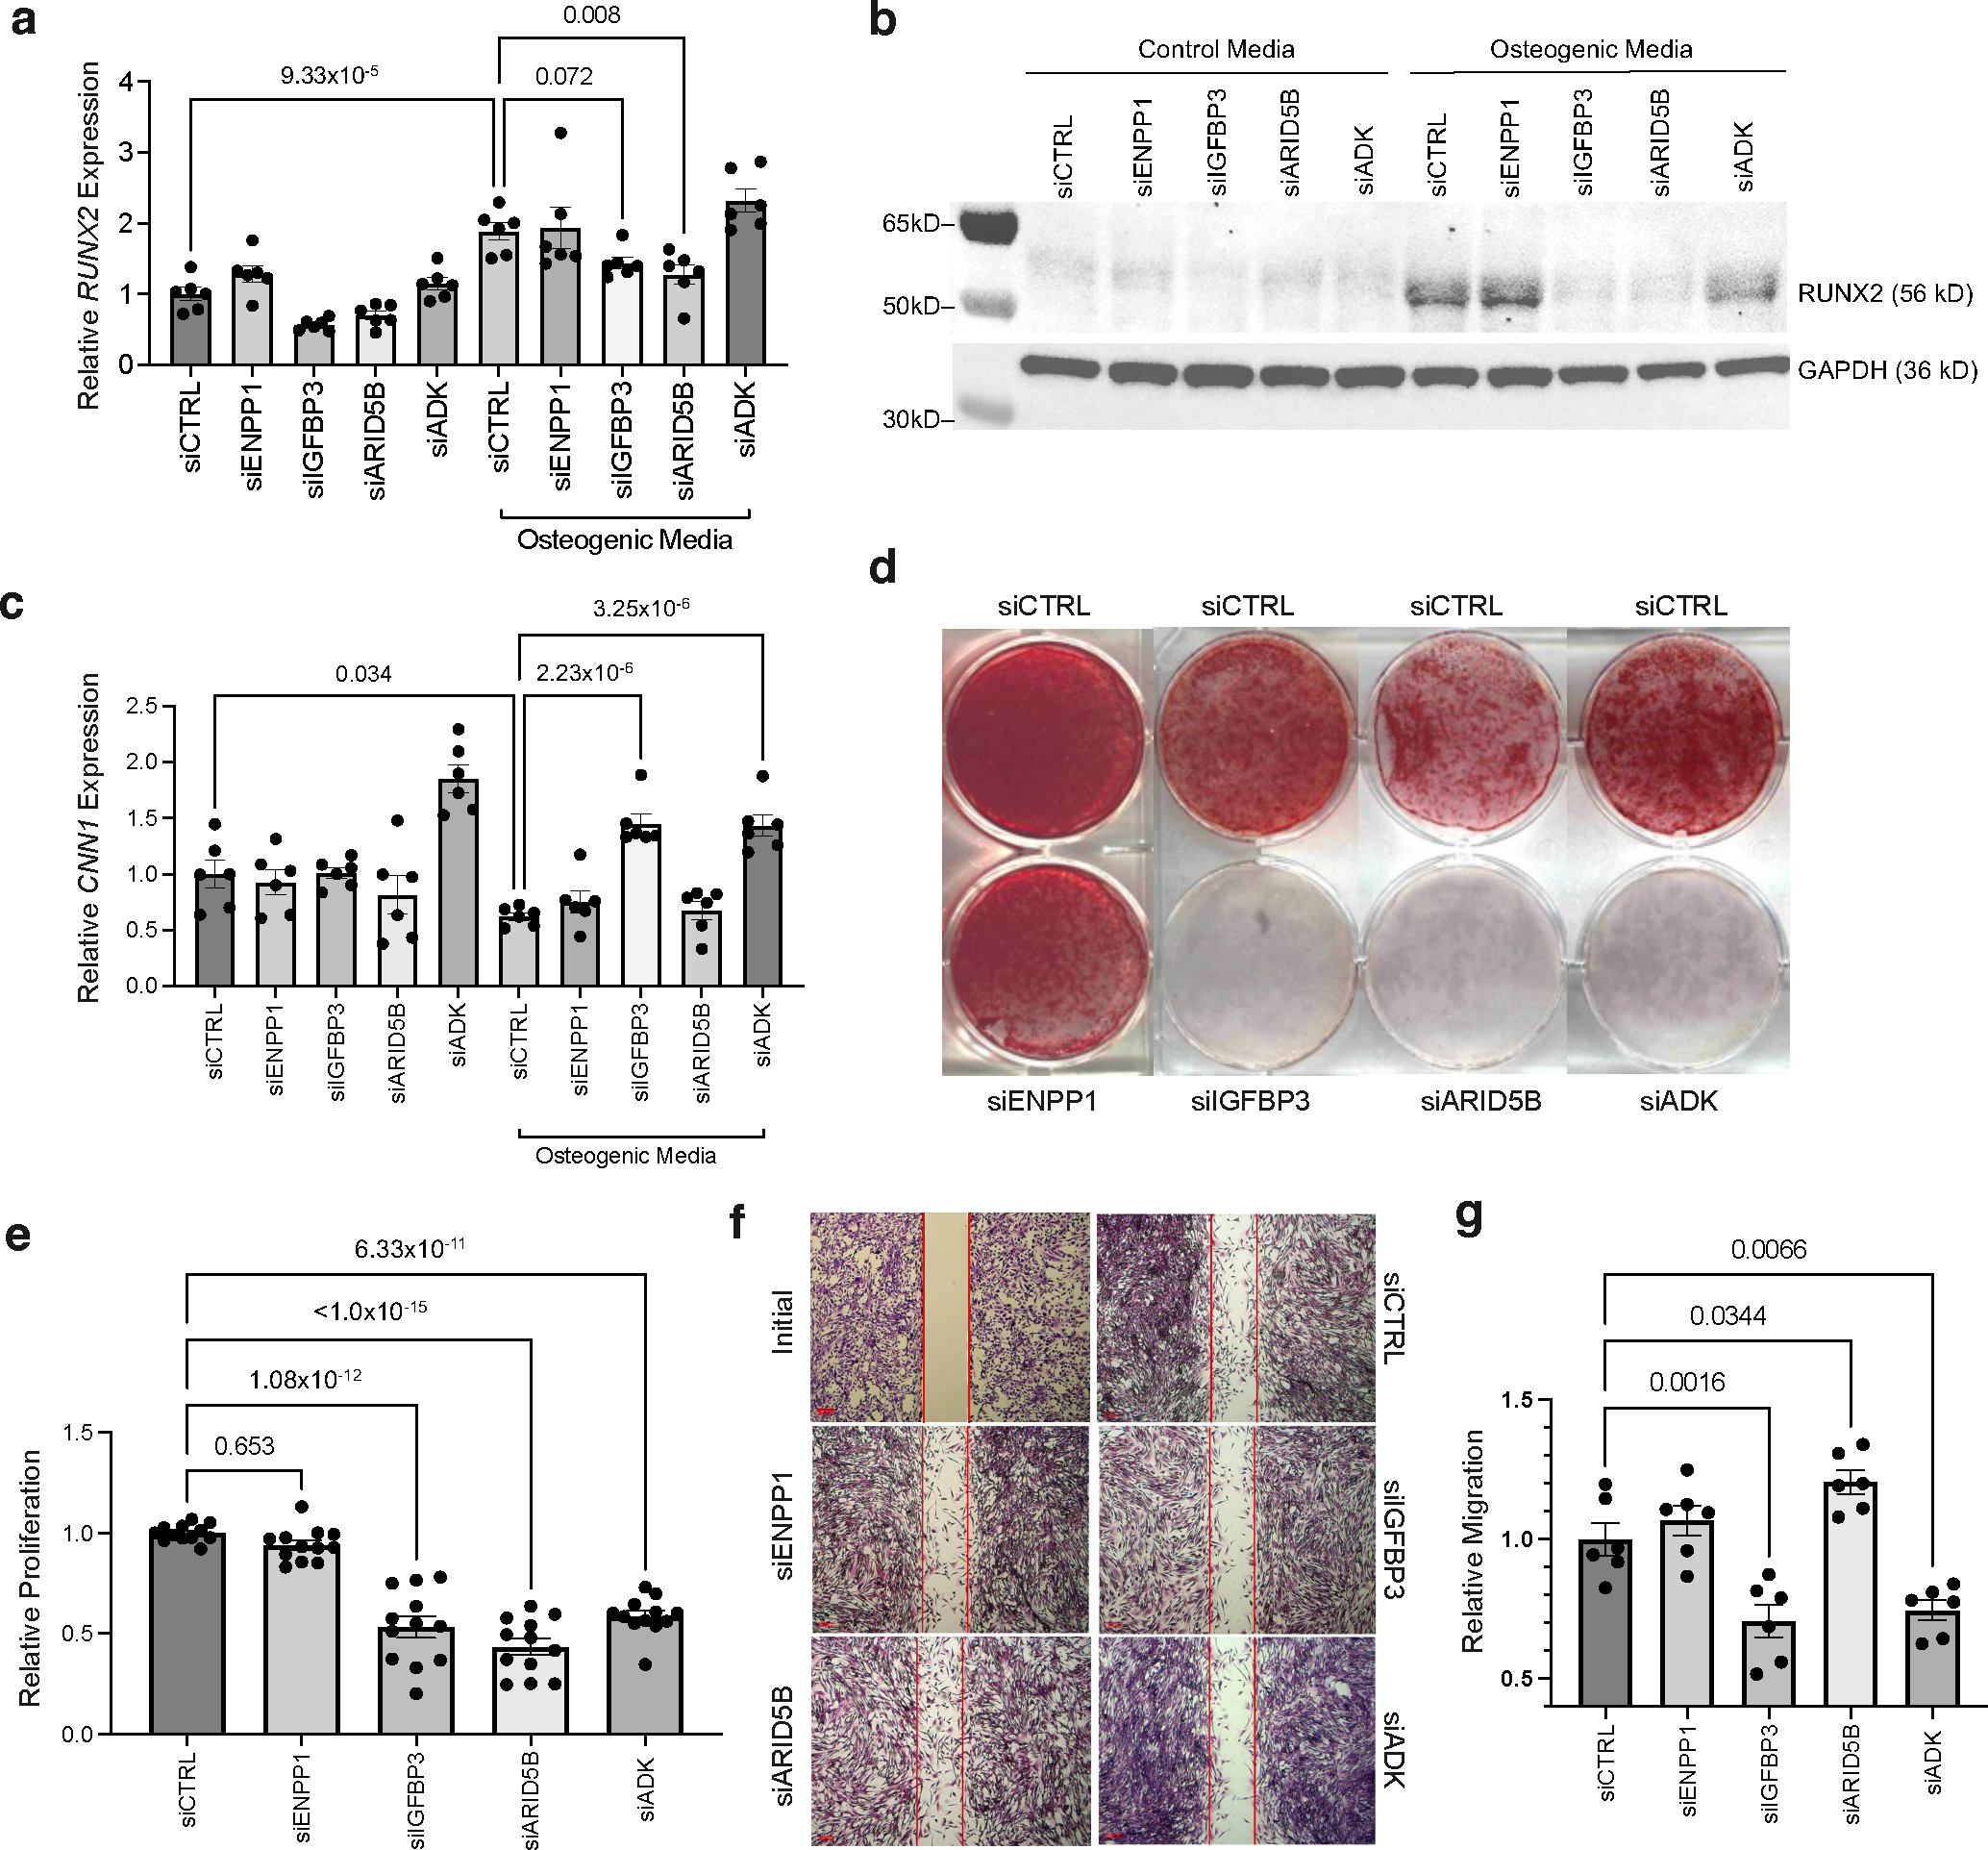
Figure 6 |. Functional assays of ENPP1, IGFBP3, ARID5B, and ADK in coronary artery calcification and vascular smooth muscle cell phenotype.

a, Effects of siRNA-mediated knockdown of ENPP1, IGFBP3, ARID5B, and ADK on osteogenic marker RUNX2 gene expression in human coronary artery smooth muscle cells (HCASMCs) cultured in control or osteogenic media (OM). n = 6 biological replicates per group. b, Western blot analysis of RUNX2 protein levels in HCASMCs cultured in basal control or OM and transfected with siCTRL, siENPP1, siIGFBP3, siARID5B, or siADK. GAPDH was used as a loading control. c, Effects of siRNA knockdown on CNN1 mRNA expression. n = 6 biological replicates per group. d, Calcification assessed by Alizarin Red staining in HCASMCs cultured in OM and transfected with siCTRL, siENPP1, siIGFBP3, siARID5B, or siADK. Representative images from three independent experiments. e, MTT assay-based proliferation in HCASMCs transfected with siCTRL, siENPP1, siIGFBP3, siARID5B or siADK. n = 12 biological replicates per treatment and control group; each individual sample read three times; value reported represents the mean of three technical replicates. f,g, Scratch wound-based migration assay in HCASMCs transfected with siCTRL, siENPP1, siIGFBP3, siARID5B or siADK, as quantified in g. An initial image of the assay is provided to demonstrate creation of a cell-free gap, prior to incubation with OM. n = 6 biological replicates per treatment and control group. Scale bars, 200 μm. All statistical comparisons shown were made using a two-tailed one-way ANOVA with Sidak’s test for multiple comparisons. Values in a-g represent mean ± standard error of the mean. Full-length blots are provided as Source Data.
