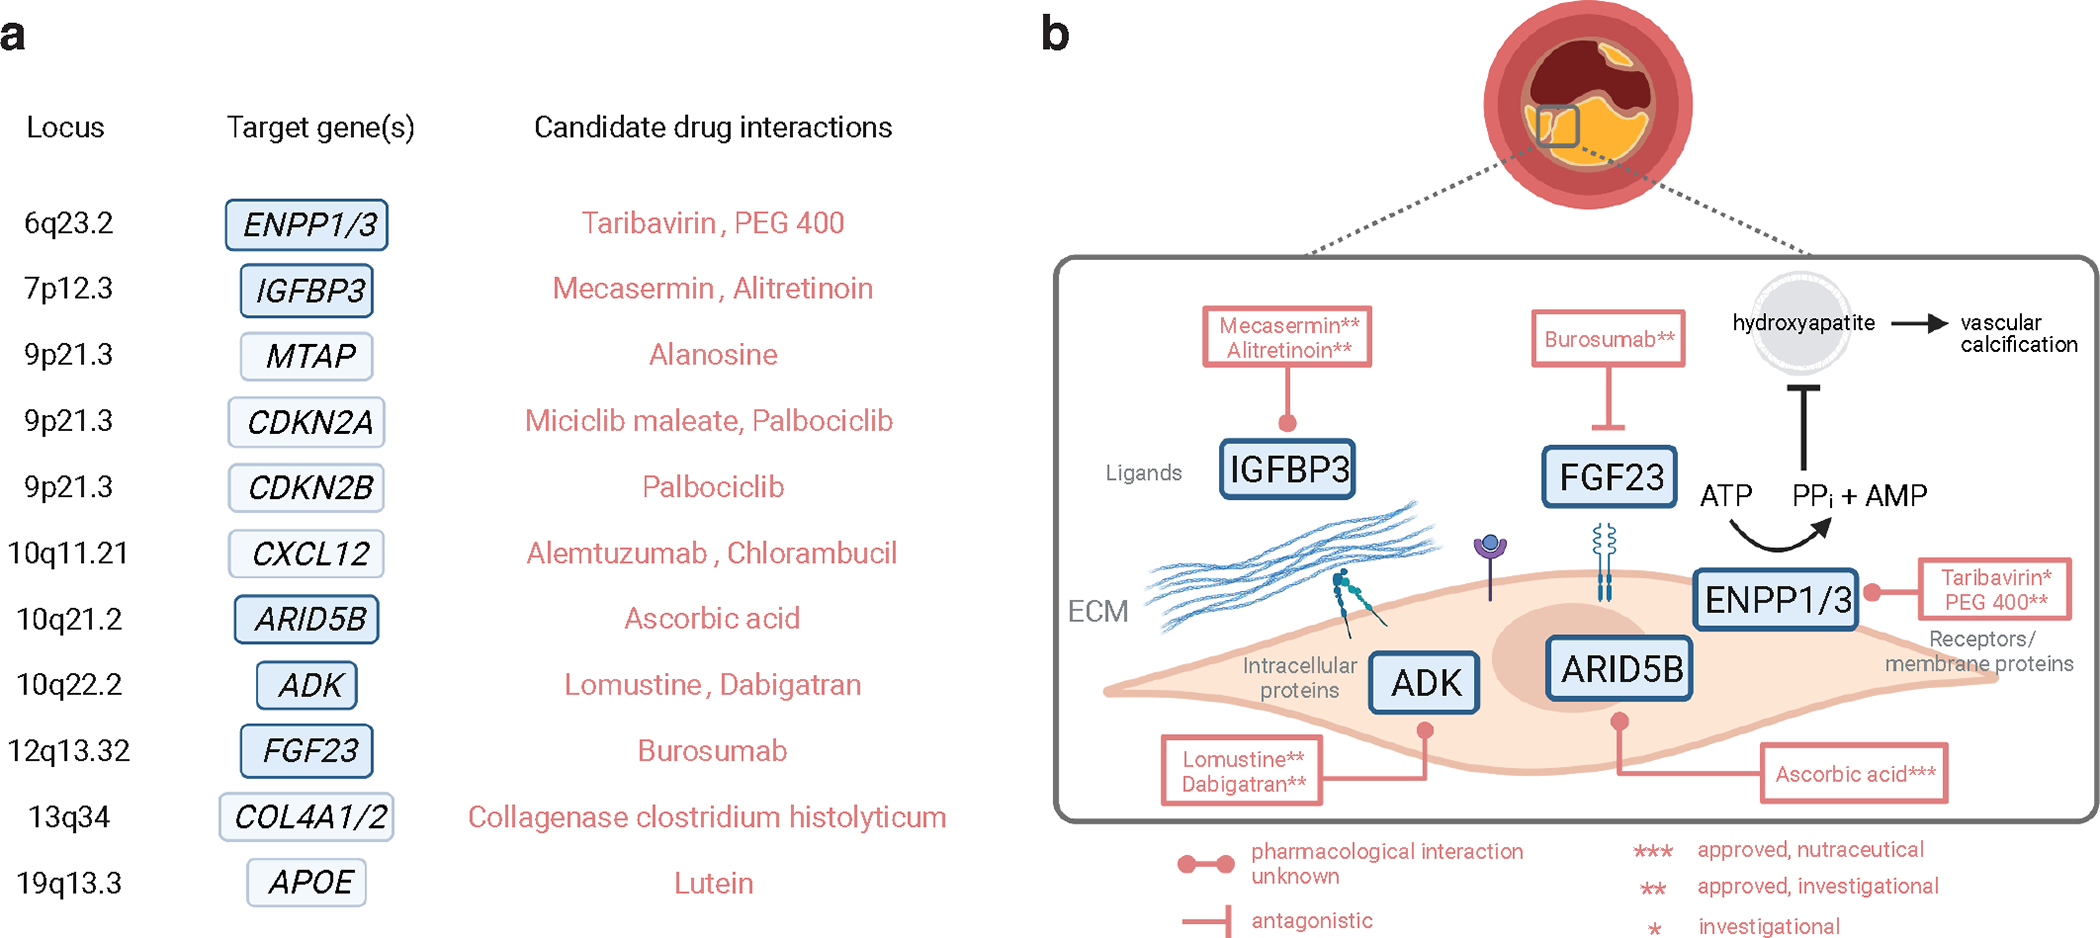
Figure 7 |. Schematic of CAC candidate genes and approved or investigational drugs.

a, Summary of gene-drug interactions for CAC candidate genes using DGIdb and DrugBank databases. Novel CAC-specific genes are shown in blue and other genes are shown in light blue corresponding to each genomic locus. Generic names for the top interacting drugs/compounds are shown for each target in red. b, Schematic showing the cellular location of the protein targets for novel CAC genes. Names of interacting approved drugs or compounds under investigation are shown along with predicted pharmacological interaction if known. ECM, extracellular matrix; ATP, adenosine triphosphate; AMP, adenosine monophosphate; PPi, inorganic pyrophosphate; PEG, polyethylene glycol. Figure created in BioRender.
