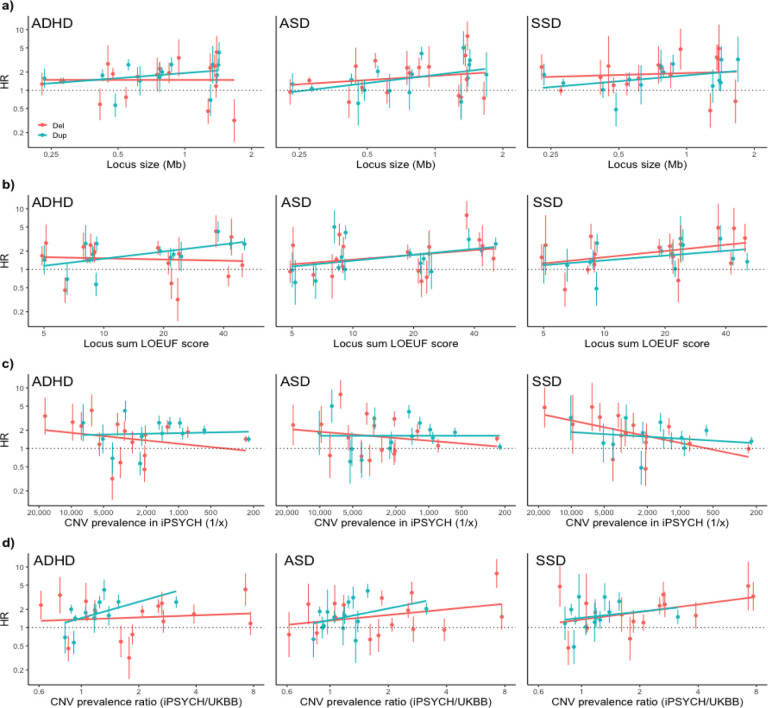
Figure 5: rCNV-associated risk as a function of locus properties and rCNV prevalence.
Hazard ratios (HR) with error bars indicating standard errors (SE) for deletions (light red) and duplications (iris blue) associated with ADHD (left), ASD (middle), and SSD (right) are plotted against a) locus size and b) sum LOEUF score28, as well as c) population prevalence in iPSYCH2015 and d) the population prevalence ratio between iPSYCH2015 and UKB12. PWAS-dup was excluded because of outlying locus size and imprinting mechanism, and 13q12.12-dup was excluded from d) owing to the outlying low iPSYCH2015/UKB prevalence ratio. The plots include fitted trend lines (created with geom_smooth). The overall trend across all three psychiatric outcomes for the two locus features and the two CNV prevalence-related features was assessed with generalised estimating equation (GEE) models including all rCNV carriers (Methods), and significant positive associations were found for locus size (P=0.0028) and sum LOEUF score (P=0.0030) as well as the prevalence ratio between iPSYCH2015 and UKB (P=0.0086), but not CNV prevalence in iPSYCH2015 (P=0.31).

