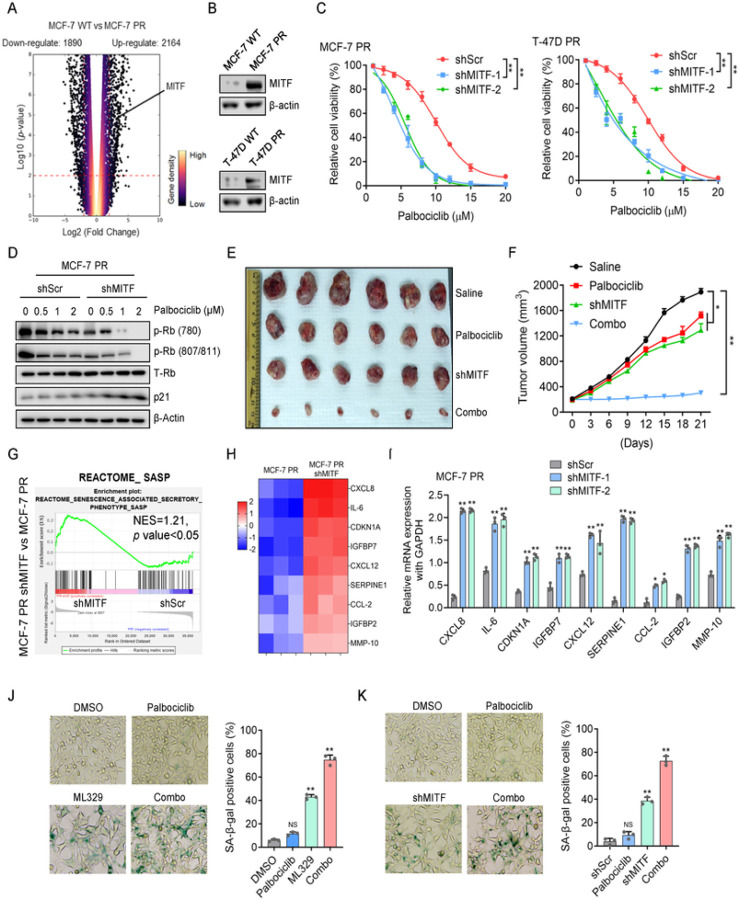
Figure 2. Inhibition of MITF overcomes palbociclib resistance by activating the senescence pathway in breast cancer cells.
(A) Volcano plot to display upregulated and downregulated genes in MCF-7 PR cells compared to MCF-7 cells. A change is considered significant if the p value is <0.05 and the change is >2-fold. (B) Cell lysates from MCF-7 and MCF-7 PR cells were immunoblotted for indicated proteins. (C) Cell viability was examined in MCF-7 PR and T-47D PR cells treated with increasing concentration of palbociclib for 3 days after MITF depletion by shRNA. Data represent means ± SD from three independent experiments. **, p£0.01. (D) MCF-7 PR cells transfected with shScr or shMITF were treated with palbociclib, followed by immunoblotting for indicated proteins. (E-F) Representative images (E) and growth curves (F) of MCF-7 PR xenograft tumors with indicated treatment for 3 weeks. Data are represented as means ± SEM, n = 6 mice/group. **, p£0.01, *, p£0.05. (G) GSEA profiling to show the enrichment of the SASP geneset in MCF7 PR cells treated with shScr or shMITF. NES score and p values were determined by GSEA software. (H) Heatmap profiling of SASP-associated factors in MCF-7 PR cell treated with shScr or shMITF. The displayed SASP-associated factors were selected from the top list of genes based on expression fold change. (I) MCF7 PR cells treated as indicated were harvested and then subjected to qPCR to examine the expression of SASP-associated factors shown in H. (J-K) Representative images of SA-β-gal staining in MCF-7 PR cells treated with ML-329 (J) or shRNAs (K). Data represent means ± SD from three independent experiments. **, p£0.01.

