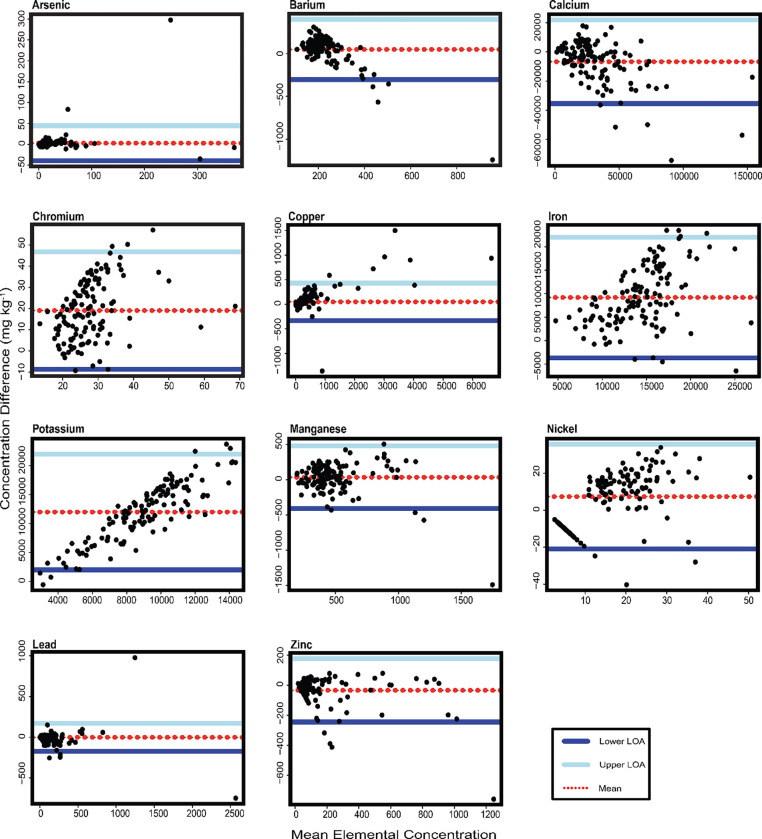
Figure 2.
Bland-Altman plots for each element measured in Arizona soil samples. The x-axis represents the mean value of both methods, and the y-axis indicates the differences between their measurements. The upper and lower limits of agreement (LoA) indicate the range in which 95% of the values from the dataset lie. The LoA is the mean difference ± 1.96 multiply by the standard deviation of the differences.

