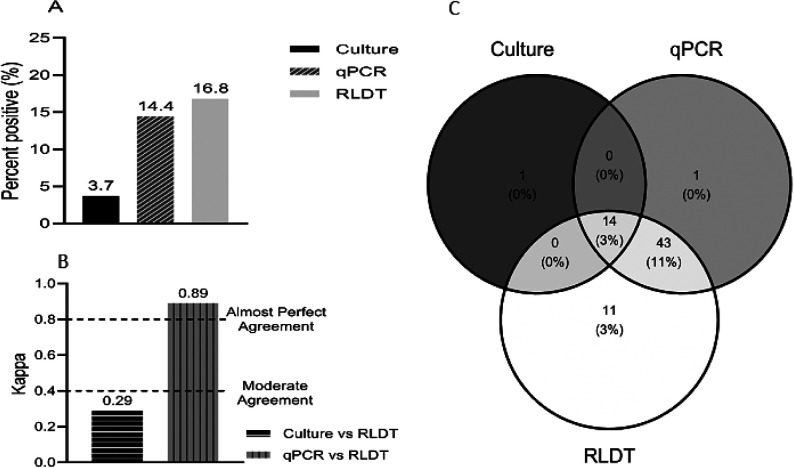
Figure 2.
Comparison between the RLDT, qPCR, and culture in the detection of ETEC. Figure 2a. Percent positives of ETEC by culture, qPCR, and RLDT. A sample is positive for ETEC when at least one of the genes LT, STh, or STp is positive. Figure 2b. Agreement of ETEC between the RLDT and culture and RLDT and qPCR using Cohen’s kappa; Figure 2c. Venn Diagram depicting identification of ETEC overlap between the three assays.

