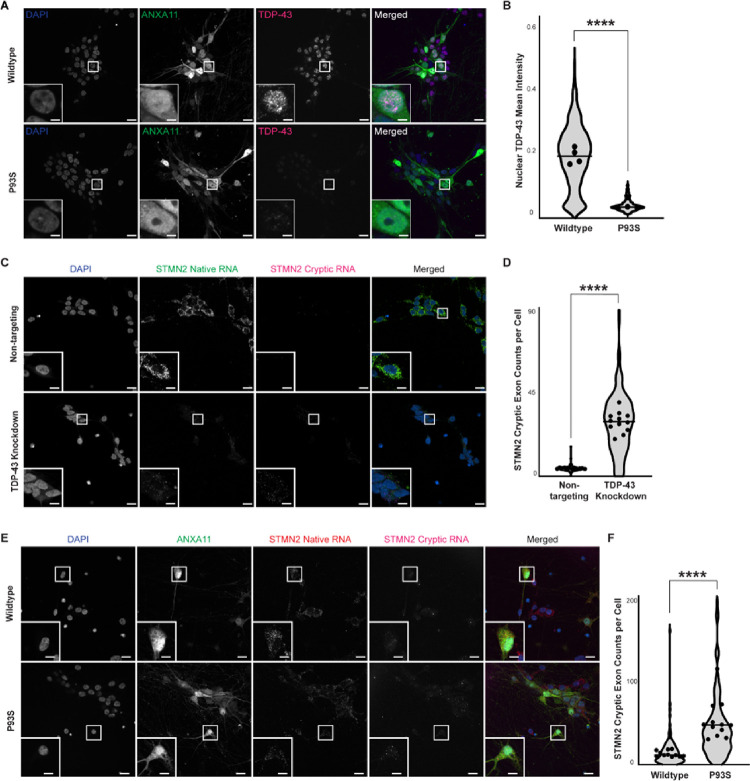
Figure 4. Decreased nuclear TDP-43 and formation of cryptic exons. (A) and (B) Decreased nuclear TDP-43 in mutant ANXA11 neurons.
(A) Representative images of fixed iPSC-derived neurons expressing wildtype and mutant ANXA11 (green) stained with TDP-43 (magenta) and Hoechst nuclear counterstaining (blue) demonstrating nuclear clearing of TDP-43 in mutant ANXA11 cells, scale bar = 25 μm, inset scale bar = 1.75 μm. (B) Quantification of mean TDP-43 intensity in wildtype compared to mutant ANXA11, well mean indicated by dot, horizontal line indicates median, p <0.0001. (C) and (D) Detection of STMN2 cryptic exon formation in TDP-43 KD neurons. (C) Representative images of fixed iPSC-derived CRISPRi neurons with control non-targeting and TDP-43 knockdown guides demonstrating detection of native STMN2 RNA (green) and cryptic RNA (magenta) using HCR FISH probes with Hoechst nuclear counterstaining (blue), scale bar = 25μm, inset scale bar = 4 μm. (D) Quantification of cryptic exon counts per cell in non-targeting and TDP-43 knockdown cells for STMN2, well mean indicated by dot, horizontal line indicates median, Mann Whitney p<0.0001. (E) and (F) Increased STMN2 cryptic exon formation in mutant ANXA11 neurons. (E) Representative images of fixed iPSC-derived neurons expressing wildtype and mutant ANXA11 (green) with HCR FISH probes for native STMN2 RNA (red) and cryptic RNA (magenta) with Hoechst nuclear counterstaining (blue), scale bar = 25 μm, inset scale bar = 4 μm. (F)Quantification of cryptic exon counts per cell in wildtype and mutant ANXA11 cells for STMN2, well mean indicated by dot, horizontal line indicates median, p<0.0001.

