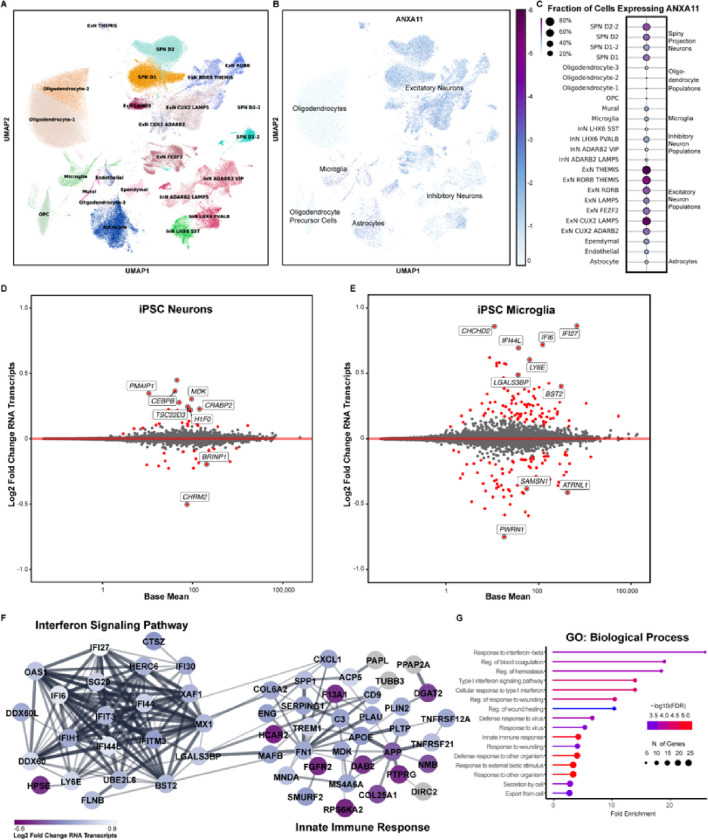
Figure 5. Transcriptomic signature of P93S.
(A)-(C) Expression map of ANXA11 in human brain cells. (A) Single nuclei sequencing data from control brains demonstrating the two cell types that highly express ANXA11, microglia and neurons. Unsupervised clustering of 34 cell types in the human brain. UMAP projections illustrating different cell types identified is shown on the left (A) and ANXA11 expression levels shown on the right (B). Scale represents log2 normalized average gene expression levels. Dot plot illustrating the mean normalized expression of ANXA11 by cell type (C). Scale represents percentage of total cell population expressing ANXA11, with color representing mean normalized expression per cell type. (D) and (E) Differential gene expression between wildtype and mutant ANXA11. (D) and (E) Bland-Altman mean difference plots where each dot indicates a gene for which there are counted reads from scRNAseq in iPSC-derived neurons (D) and iPSC-derived microglia (E). The x-axis is average normalized counts and the y-axis is log2 fold change. Neuronal differential expression yields few significant genes related to transcriptional regulation and endocytic vesicles (D) while many more differentially expressed in microglia related to transcriptional regulation and endocytic vesicles (E). (F) and (G) Differential microglial gene expression interferon signaling pathway. (F) STRING diagram of differentially expressed microglial genes in the interferon signaling pathway and innate immune response. Colors indicate padj. (G) Gene ontology terms for biological processes of microglial gene expression hits indicating interferon response and innate immunity. Dot size indicates number of genes in each GO grouping and color indicates −log10(FDR).

