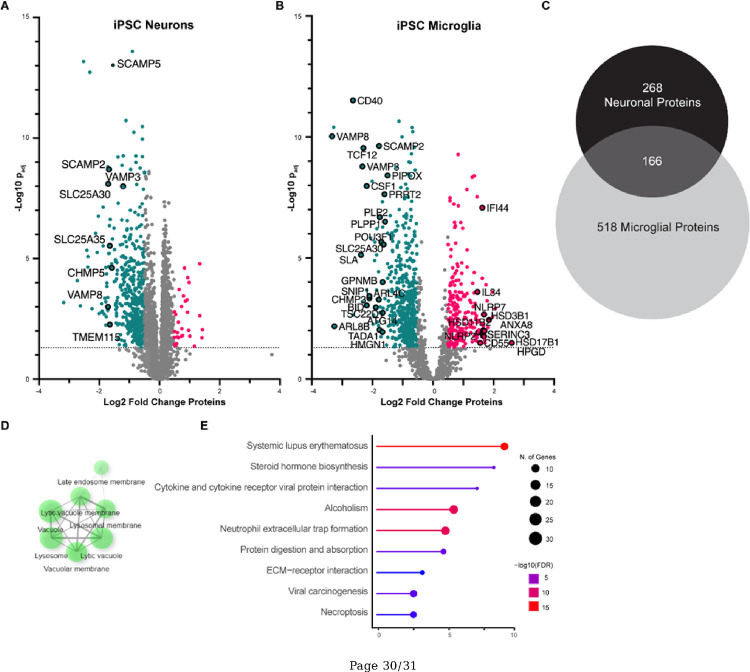
Figure 6. Proteomic signature of P93S.
(A) Volcano plot of proteomic changes in neurons identifying significant changes in proteins involved in vesicle transport and SNARES, corroborating functional assays indicating that P93S disrupts proper functioning of ANXA11. (B) Volcano plot of proteomic changes of mutant compared to wildtype microglia implicating inflammatory pathways, as well as transcriptional regulation and vesicular transport. Lipid metabolism protein perturbations seen are indicative of microglial dysfunction. Red dots indicate upregulated proteins (FC>2) and blue dots indicate downregulated proteins (FC<−2). Dotted line demarcates a −log10 of padj value of 1.3. (C)-(E) Unique microglia proteomic signature. (C) Venn diagram of significant differentially expressed proteins in neuron (n = 434) compared to microglia (n = 684). Significant is defined as padj>0.05. (D) Non-overlapping significant microglial proteins cluster in the lysosomal cellular component gene ontology. (E) Representation of KEGG terms of non-overlapping significant microglial proteins. Dot size indicates number of genes in each GO grouping and color indicates −log10(FDR).

