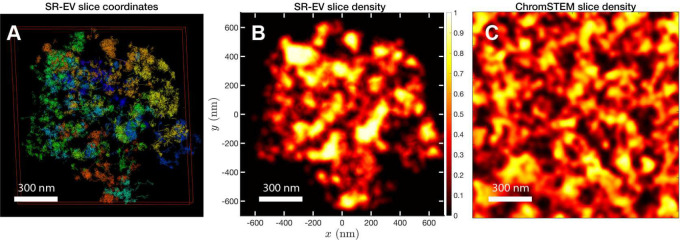
Figure 3: Slab images:
A) representation of a 100 nm slab cut at the center of a SR-VE conformation obtained with and . B) 2D chromatin density corresponding to coordinates of panel A). C) ChromSTEM 2D chromatin density obtained from a 100 nm slab of a A549 cell. The 2D density color scale is the same for B) and C), and the density is normalized to its highest value in each image.

